Ich wollte euch mal ein paar meiner Karten hier lassen…vielleicht kann sie der ein oder andere ja gebrauchen…
Ich bin ja ein Statistikfreak und werte mir so allerlei Dinge aus….
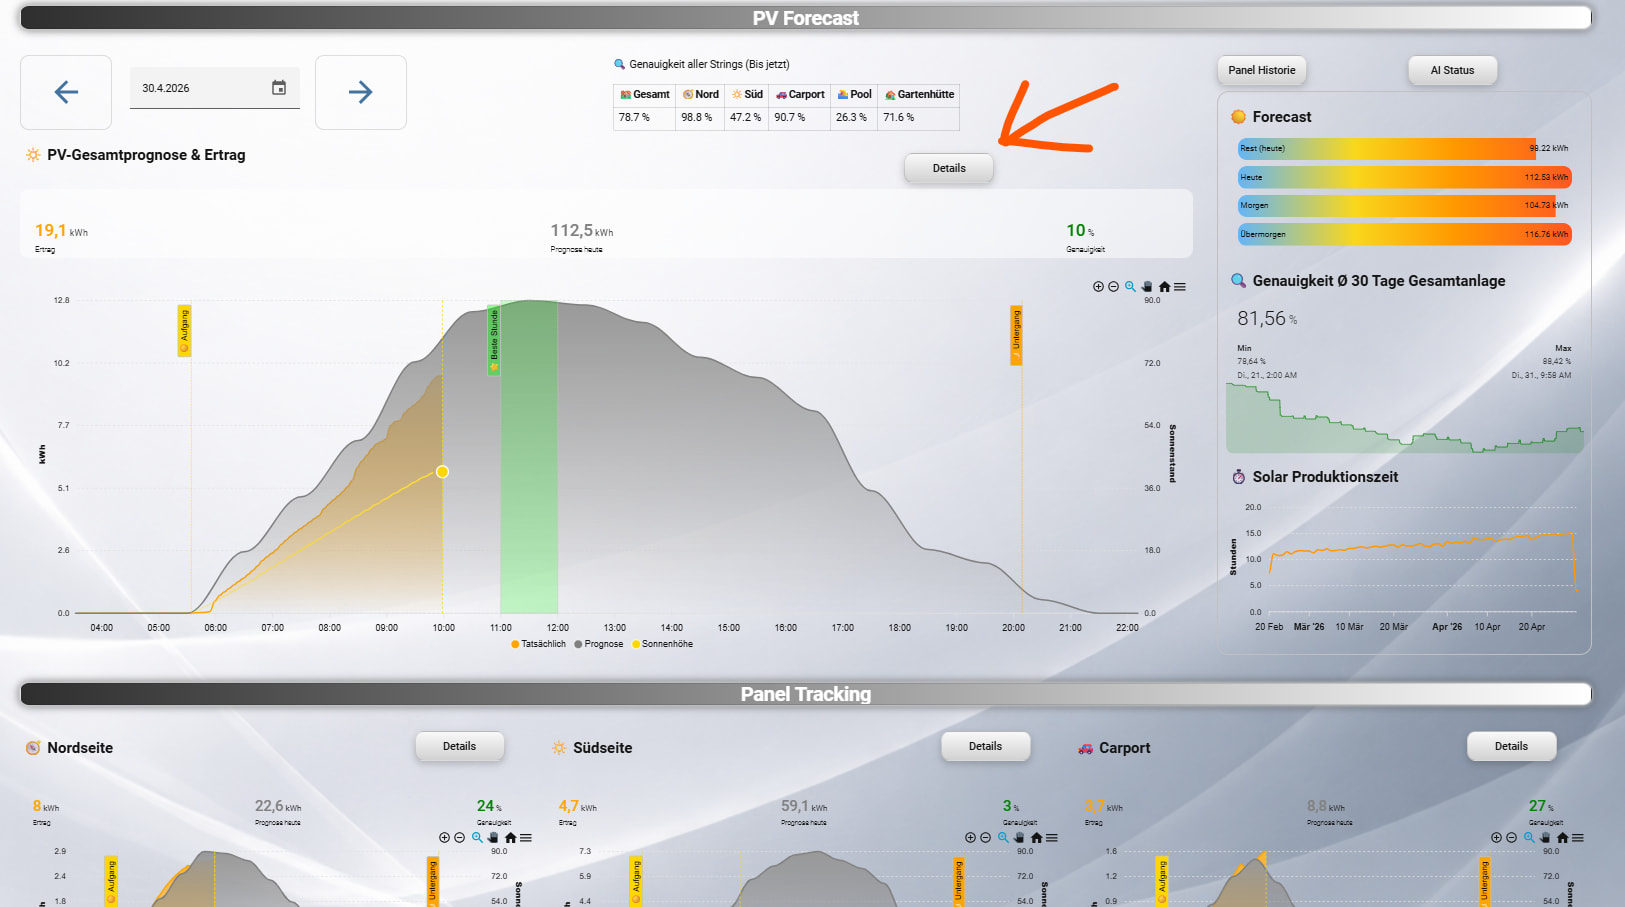
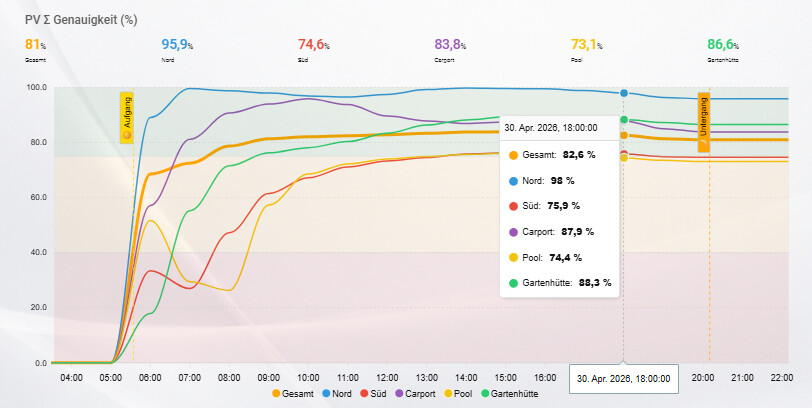
- Laufende Tages-Genauigkeit aller Strings (inkl Sonnenauf- und Untergang sowie Farbbereiche für die Genauigkeit.
Anpassung lediglich in den Series eure Entitäten und die Betitelung
type: custom:config-template-card
entities:
  - sensor.sun_next_rising
  - sensor.sun_next_setting
card:
  type: custom:apexcharts-card
  graph_span: |-
    ${(() => {
      const rise = new Date(states['sensor.sun_next_rising'].state);
      const set  = new Date(states['sensor.sun_next_setting'].state);
      const now  = new Date();

      if (rise.getDate() !== now.getDate()) rise.setDate(rise.getDate() - 1);
      if (set.getDate() !== now.getDate())  set.setDate(set.getDate() - 1);

      return Math.round((set - rise) / 60000) + 240 + "m";
    })()}
  span:
    start: day
    offset: |-
      ${(() => {
        const rise = new Date(states['sensor.sun_next_rising'].state);
        const now  = new Date();

        if (rise.getDate() !== now.getDate()) rise.setDate(rise.getDate() - 1);

        return "+" + ((rise.getHours() * 60 + rise.getMinutes()) - 120) + "m";
      })()}
  header:
    title: PV Σ Genauigkeit (%)
    show: true
    show_states: true
    colorize_states: true
  apex_config:
    chart:
      height: 450
    xaxis:
      type: datetime
    yaxis:
      min: 0
      max: 100
    tooltip:
      shared: true
      intersect: false
    annotations:
      yaxis:
        - "y": 40
          y2: 0
          borderWidth: 0
          fillColor: rgba(198,40,40,0.3)
        - "y": 75
          y2: 40
          borderWidth: 0
          fillColor: rgba(249,168,37,0.3)
        - "y": 100
          y2: 75
          borderWidth: 0
          fillColor: rgba(46,125,50,0.3)
      xaxis:
        - x: |-
            ${(() => {
              const r = new Date(states['sensor.sun_next_rising'].state);
              const n = new Date();
              if (r.getDate() !== n.getDate()) r.setDate(r.getDate() - 1);
              return r.getTime();
            })()}
          borderColor: gold
          strokeDashArray: 4
          label:
            text: ☀️ Aufgang
            style:
              color: black
              background: gold
        - x: |-
            ${(() => {
              const s = new Date(states['sensor.sun_next_setting'].state);
              const n = new Date();
              if (s.getDate() !== n.getDate()) s.setDate(s.getDate() - 1);
              return s.getTime();
            })()}
          borderColor: orange
          strokeDashArray: 4
          label:
            text: 🌙 Untergang
            style:
              color: black
              background: orange
  all_series_config:
    stroke_width: 2
    unit: "%"
    data_generator: |
      let raw = entity.attributes.hourly_data;
      if (typeof raw === "string") raw = JSON.parse(raw);

      const now = new Date().getHours();

      const base = new Date();
      base.setHours(0,0,0,0);
      const baseTs = base.getTime();

      let sumPred = 0;
      let sumAct = 0;

      const map = {};
      raw.forEach(h => map[h.hour] = h);

      const result = [];

      for (let hour = 0; hour < now; hour++) {
        const h = map[hour] || { pred: 0, actual: 0 };

        sumPred += h.pred || 0;
        sumAct += h.actual || 0;

        const acc = sumPred
          ? (100 - Math.abs(sumAct - sumPred) / sumPred * 100)
          : 0;

        result.push([
          baseTs + hour * 3600000,
          acc
        ]);
      }

      return result;
  series:
    - entity: sensor.sfml_stats_gesamt
      name: Gesamt
      color: orange
      type: line
      stroke_width: 4
      show:
        legend_value: false
    - entity: sensor.sfml_stats_pv_nordseite
      name: Nord
      type: line
      show:
        legend_value: false
    - entity: sensor.sfml_stats_pv_sudseite
      name: Süd
      type: line
      show:
        legend_value: false
    - entity: sensor.sfml_stats_pv_carport
      name: Carport
      type: line
      show:
        legend_value: false
    - entity: sensor.sfml_stats_pv_pool
      name: Pool
      type: line
      show:
        legend_value: false
    - entity: sensor.sfml_stats_pv_gartenhutte
      name: Gartenhütte
      type: line
      show:
        legend_value: false
  card_mod:
    style: |
      ha-card {
        background: transparent;
        box-shadow: none;
        overflow: hidden;
        border: none;
        font-size: 10px;
      }
grid_options:
  columns: 24
  rows: auto
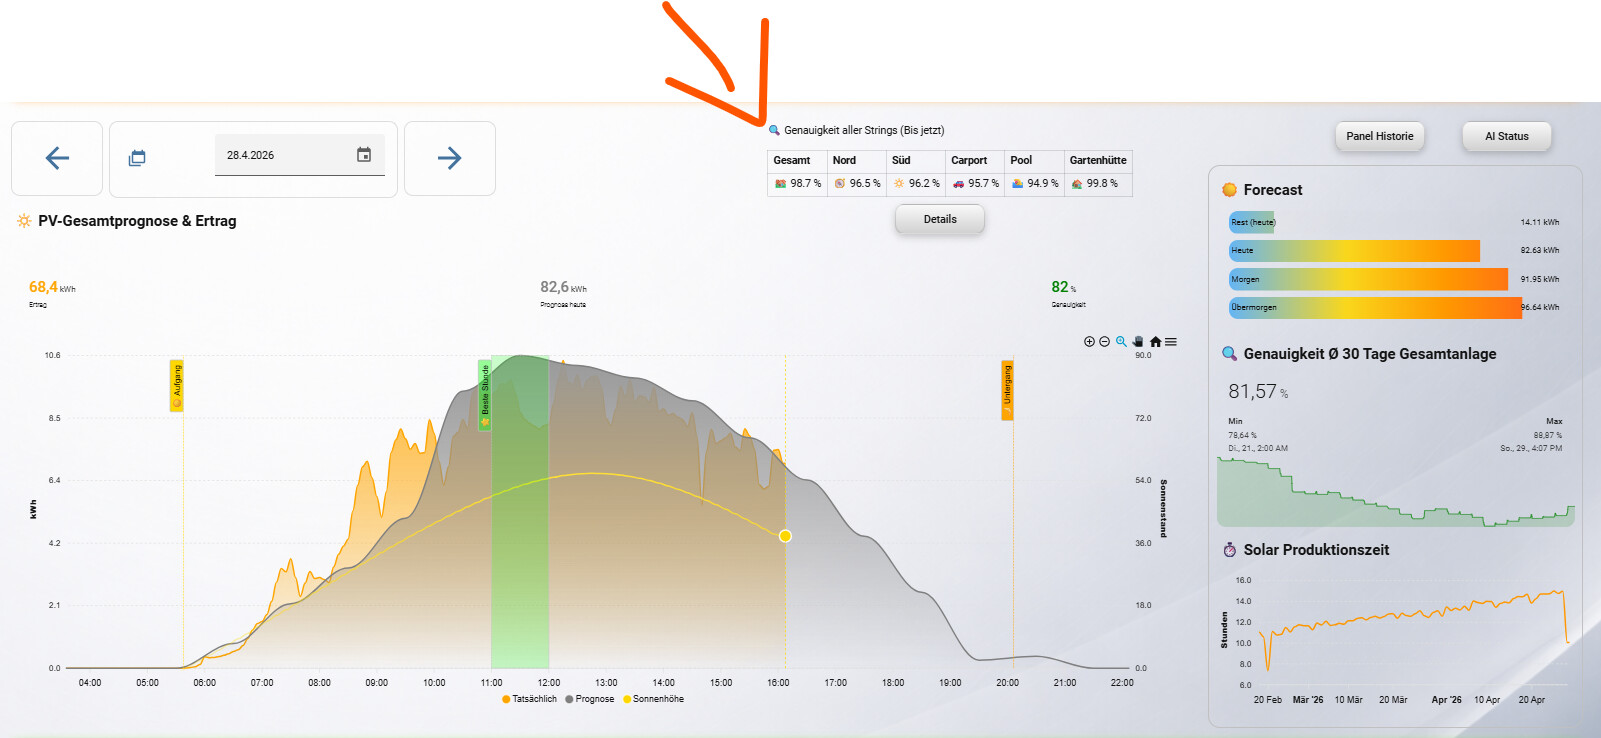
- Markdown Karte mit der aktuellen Tages-Genauigkeit aller Strings
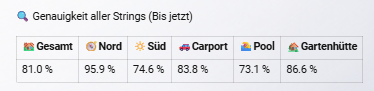
Ist ne praktische Mini-Karte fürs Dashboard - selbe Ansicht wie der Apex Graph nur in klein
type: markdown
content: >

  🔍 Genauigkeit aller Strings (Bis jetzt)

  {% set current_hour = now().hour %}

  {# ===================== HELPER ===================== #} {% macro
  calc_acc(data) %}
    {% set ns = namespace(act=0, pred=0) %}
    {% for h in data %}
      {% if h.hour < current_hour %}
        {% set ns.act = ns.act + (h.actual | float(0)) %}
        {% set ns.pred = ns.pred + (h.pred | float(0)) %}
      {% endif %}
    {% endfor %}
    {{ (100 - ((ns.act - ns.pred) | abs / ns.pred * 100)) if ns.pred != 0 else 0 }}
  {% endmacro %}

  {# ===================== DATEN ===================== #}

  {% set g = state_attr('sensor.sfml_stats_gesamt','hourly_data') %} {% set g =
  g | from_json if g is string else g %}

  {% set n = state_attr('sensor.sfml_stats_pv_nordseite','hourly_data') %} {%
  set n = n | from_json if n is string else n %}

  {% set s = state_attr('sensor.sfml_stats_pv_sudseite','hourly_data') %} {% set
  s = s | from_json if s is string else s %}

  {% set c = state_attr('sensor.sfml_stats_pv_carport','hourly_data') %} {% set
  c = c | from_json if c is string else c %}

  {% set p = state_attr('sensor.sfml_stats_pv_pool','hourly_data') %} {% set p =
  p | from_json if p is string else p %}

  {% set gh = state_attr('sensor.sfml_stats_pv_gartenhutte','hourly_data') %} {%
  set gh = gh | from_json if gh is string else gh %}

  <table>
    <tr>
      <th>🏘️Gesamt</th>
      <th>🧭Nord</th>
      <th>🔆Süd</th>
      <th>🚗Carport</th>
      <th>🏊Pool</th>
      <th>🏡Gartenhütte</th>
    </tr>

    <tr>
      <td> {{ calc_acc(g) | round(1) }} %</td>
      <td> {{ calc_acc(n) | round(1) }} %</td>
      <td> {{ calc_acc(s) | round(1) }} %</td>
      <td> {{ calc_acc(c) | round(1) }} %</td>
      <td> {{ calc_acc(p) | round(1) }} %</td>
      <td> {{ calc_acc(gh) | round(1) }} %</td>
    </tr>

  </table>
grid_options:
  columns: 15
  rows: auto
text_only: true
Ihr braucht nur eure Entitäten bei “DATEN” eintragen - wenn ihr weniger Strings habt, dann einfach die überflüssigen Zeilen löschen - ebenso weiter unten bei
die Ausgabe anpassen.
Oder ihr schmeißt das Ding in ChatGPT rein - der baut euch das sofort um.
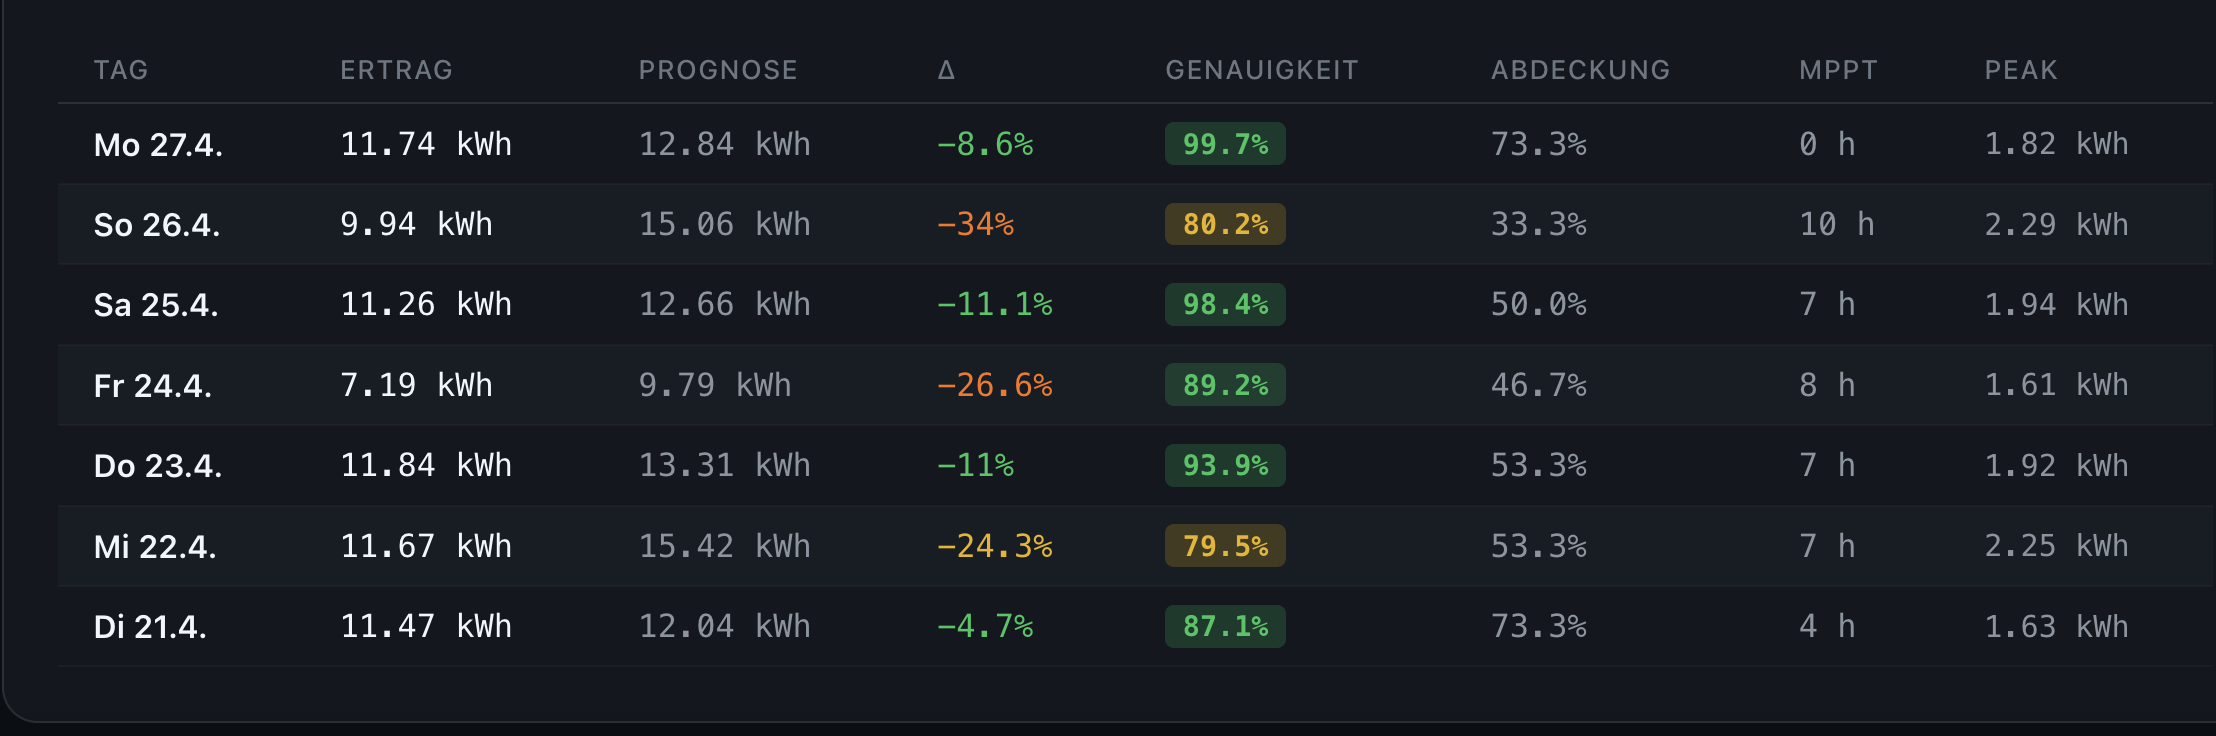
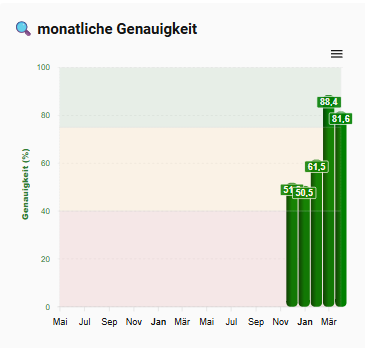
- monatliche Genauigkeit (damit tracke ich zB, wie genau SFML in dem entsprechenden Monat agiert)
type: vertical-stack
cards:
  - type: markdown
    content: |
      ## 🔍 monatliche Genauigkeit
    text_only: true
    card_mod:
      style: |
        ha-card {
          background: transparent;
          box-shadow: none;
          border: none;
          padding: 6px 0px;
        }

        ha-markdown {
          text-align: center;
        }
  - type: custom:apexcharts-card
    header:
      title: " "
      show: true
    graph_span: 2y
    series:
      - entity: sensor.solar_forecast_ml_o_genauigkeit_30_tage
        name: Genauigkeit Heute
        color: green
        type: column
        group_by:
          duration: 1month
          func: last
        show:
          legend_value: false
          in_header: false
          in_legend: true

    apex_config:
      chart:
        height: 380
        toolbar:
          show: true
        zoom:
          enabled: false
          type: x
          autoScaleYaxis: true
      xaxis:
        type: datetime
        labels:
          format: MMM
      yaxis:
        min: 0
        max: 100
        title:
          text: Genauigkeit (%)
          style:
            color: "#2e7d32"
        labels:
          formatter: |
            EVAL:(value) => Math.round(value)
          style:
            colors:
              - "#2e7d32"
      legend:
        show: true
      grid:
        borderColor: rgba(150,150,150,0.15)
        strokeDashArray: 3
      plotOptions:
        bar:
          borderRadius: 5
          columnWidth: 15
          dataLabels:
            position: top
      fill:
        type: gradient
      annotations:
        yaxis:
          - "y": 40
            y2: 0
            borderWidth: 0
            fillColor: rgba(198,40,40,0.3)
          - "y": 75
            y2: 40
            borderWidth: 0
            fillColor: rgba(249,168,37,0.3)
          - "y": 100
            y2: 75
            borderWidth: 0
            fillColor: rgba(46,125,50,0.3)
    all_series_config:
      type: column
      show:
        datalabels: true
    card_mod:
      style: |
        ha-card {
          background: transparent !important;
          box-shadow: none !important;
          border: none;
          margin-top: -30px;
          padding: 10px;
          font-size: 11px;
        }
grid_options:
  columns: 18
  rows: auto
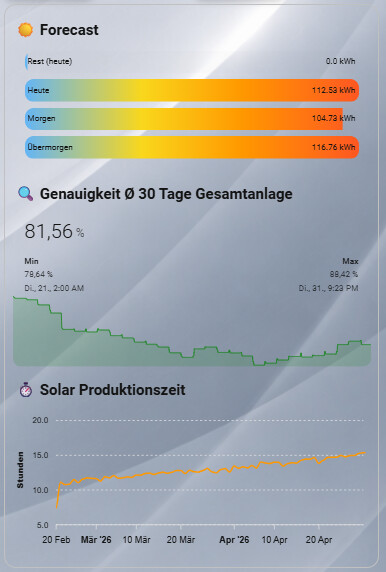
- Ist eine Kurzansicht auf meinem Dashboard über ein paar wichtige Dinge wie Forecast, Genauigkeit und Tagesproduktionszeit:
type: custom:mod-card
card_mod:
  style: |
    ha-card {
      background: transparent;
      border: 2px solid silver;
      border-radius: 16px;
      padding: 10px;
    }
card:
  type: vertical-stack
  cards:
    - type: grid
      columns: 1
      square: false
      cards:
        - type: markdown
          content: |
            ## ☀️ Forecast
          text_only: true
          card_mod:
            style: |
              ha-card {
                background: transparent;
                box-shadow: none;
                border: none;
                padding: 6px 0px;
              }

              ha-markdown {
                text-align: center;
              }
        - type: custom:bar-card
          title: " "
          direction: right
          stack: vertical
          height: 30px
          positions:
            icon: "off"
            name: inside
            value: inside
          entities:
            - entity: sensor.none_forecast_today_remaining
              name: Rest (heute)
            - entity: sensor.none_prognose_heute
              name: Heute
            - entity: sensor.none_prognose_morgen
              name: Morgen
            - entity: sensor.none_prognose_ubermorgen
              name: Übermorgen
          unit_of_measurement: kWh
          min: -1
          max: 110
          card_mod:
            style: |
              ha-card {
                background: transparent;
                box-shadow: none;
                border: none;
                margin-top: -20px;
                font-size: 11px;
              }

              bar-card-backgroundbar {
                background: rgba(255,255,255,0.08);
                border-radius: 12px;
              }

              bar-card-currentbar {
                background: linear-gradient(
                  90deg,
                  #64b5f6 0%,
                  #f9d71c 35%,
                  #ff9800 65%,
                  #ff5722 100%
                );
                border-radius: 12px;

                clip-path: polygon(
                  0 0,
                  var(--bar-percent) 0,
                  var(--bar-percent) 100%,
                  0 100%
                );
              }
        - type: markdown
          content: |
            ## 🔍 Genauigkeit Ø 30 Tage Gesamtanlage
          text_only: true
          card_mod:
            style: |
              ha-card {
                background: transparent;
                box-shadow: none;
                border: none;
                padding: 6px 0px;
              }

              ha-markdown {
                text-align: center;
              }
    - type: custom:mini-graph-card
      entities:
        - entity: sensor.solar_forecast_ml_o_genauigkeit_30_tage
          name: Genauigkeit
      name: " "
      show:
        icon: false
        name: true
        state: true
        graph: line
        extrema: true
      line_color: green
      line_width: 1
      show_fill: true
      fill_color: green
      hours_to_show: 720
      points_per_hour: 1
      animate: true
      font_size: 80
      smooth: true
      y_axis: true
      group: false
      card_mod:
        style: |
          ha-card {
            background: transparent;
            border: none;
            margin-top: -50px;
            border-radius: 12px;
            padding: 6px;
          }
    - type: markdown
      content: |
        ## ⏱️ Solar Produktionszeit
      text_only: true
      card_mod:
        style: |
          ha-card {
            background: transparent;
            box-shadow: none;
            border: none;
            padding: 6px 0px;
          }

          ha-markdown {
            text-align: center;
          }
    - type: custom:apexcharts-card
      graph_span: 70d
      span:
        end: day
      header:
        show: true
        title: " "
      series:
        - entity: sensor.none_produktionszeit_heute
          name: Produktionszeit in Stunden
          type: line
          group_by:
            duration: 1d
            func: last
          stroke_width: 2
          curve: smooth
          transform: |
            if (!x || x === "unknown" || x === "unavailable") return null;
            const p = x.split(':');
            if (p.length < 3) return null;
            const sec = (+p[0]) * 3600 + (+p[1]) * 60 + (+p[2]);
            return sec / 3600;
      apex_config:
        chart:
          height: 200
        yaxis:
          title:
            text: Stunden
        tooltip:
          "y":
            formatter: |
              function(val) {
                if (val === null) return "-";
                return val.toFixed(2) + " h";
              }
      card_mod:
        style: |
          ha-card {
            background: transparent;
            box-shadow: none;
            font-size: 11px;
            border: none;
            margin-top: -30px;
          }
grid_options:
  columns: 12
  rows: auto
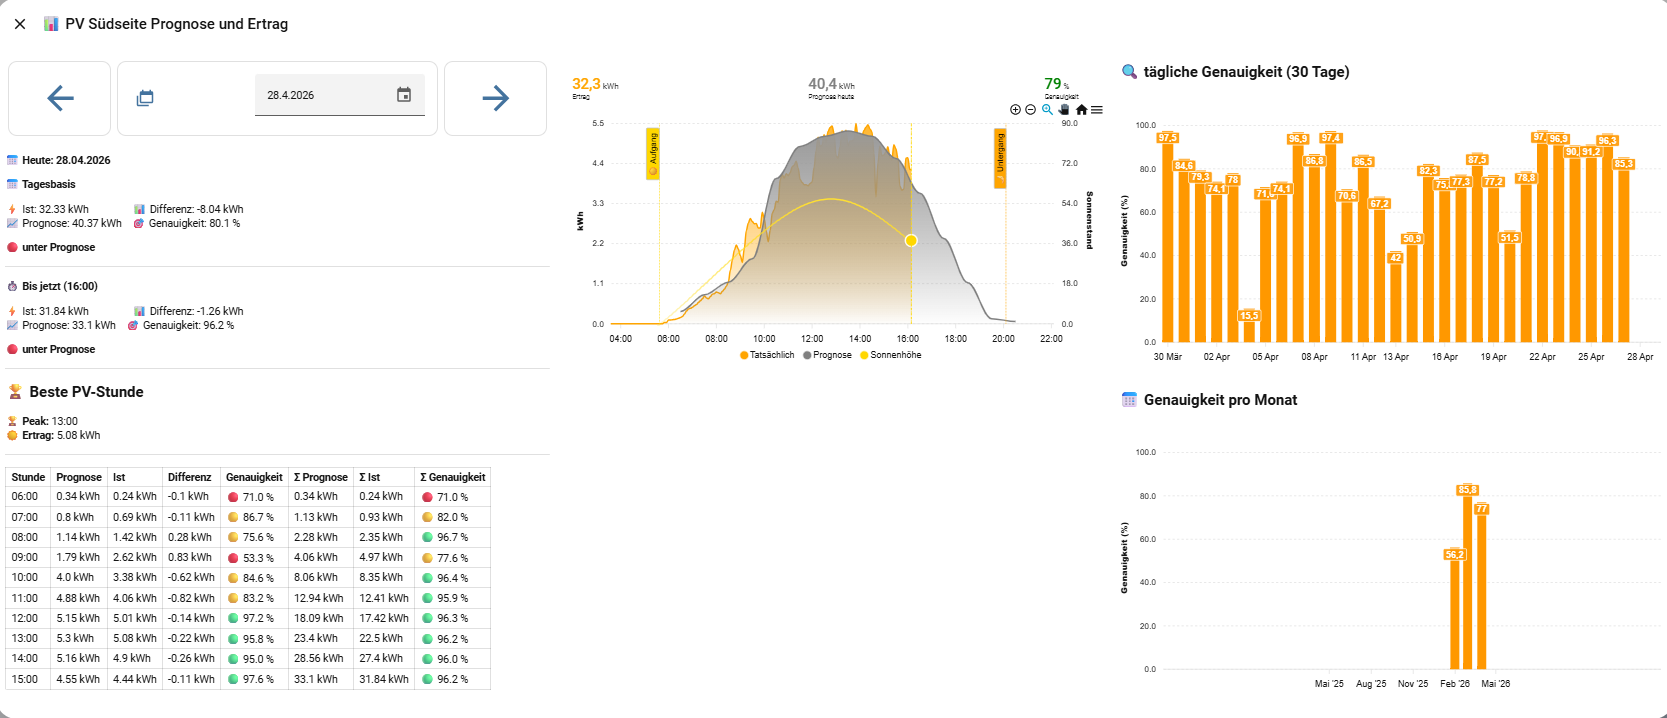
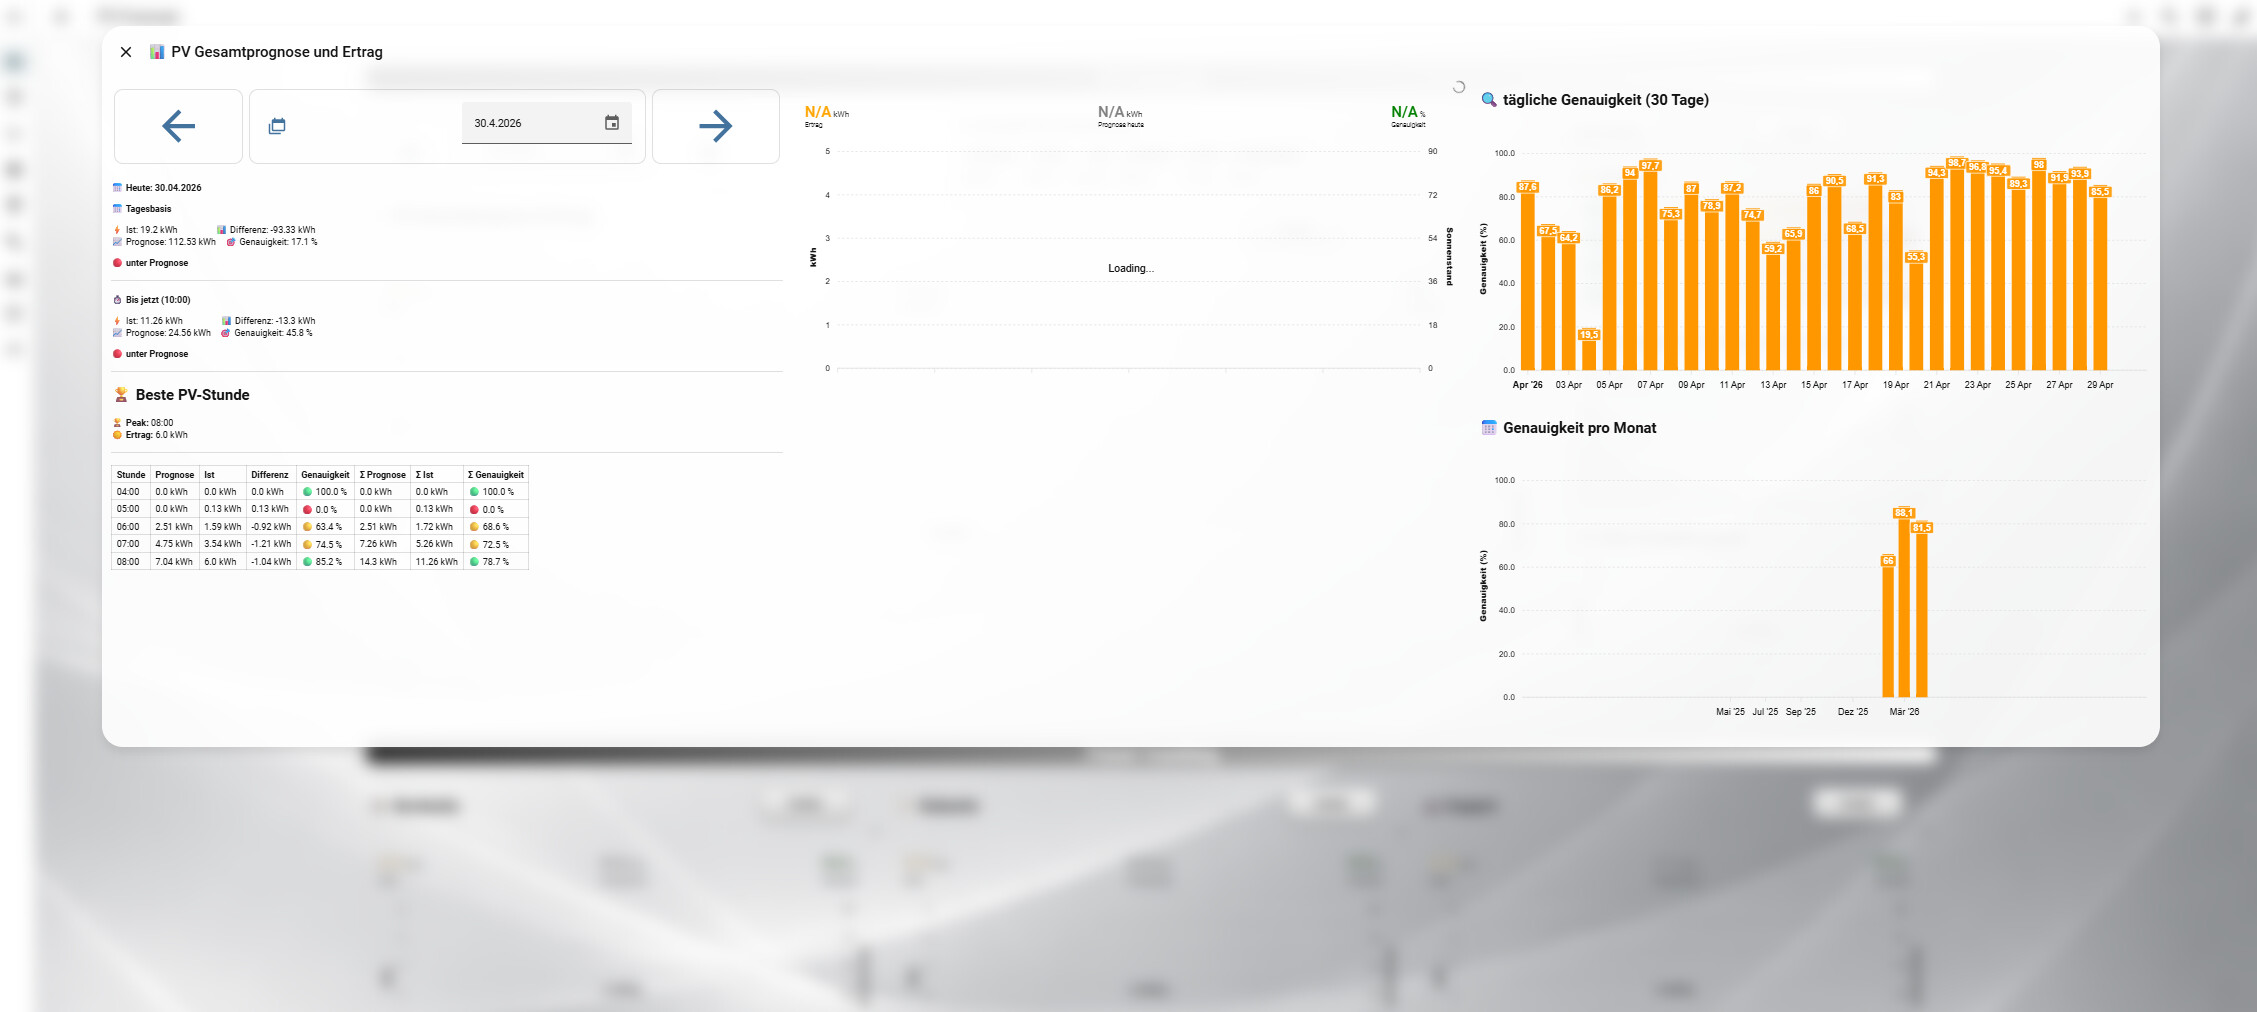
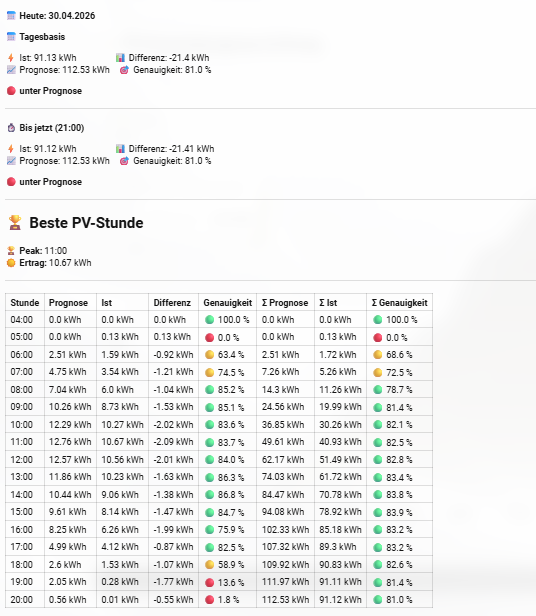
- Aufschlüsselung der Gesamtgenauigkeit sowie Genauigkeit pro Stunde
type: markdown
content: >-
📅 **Heute: {{ now().strftime('%d.%m.%Y') }}**
{% set actual =
states('sensor.pv_ertrag_pro_tag_insgesamt') | float %}
{% set raw = state_attr('sensor.sfml_stats_gesamt',
'hourly_data') %}
{% set data = raw | from_json if raw is string else raw
%}
{% set ns = namespace(pred_total=0, best_hour=None,
best_pv=0) %}
{% for h in data %}
{% if h.pred is not none %}
{% set ns.pred_total = ns.pred_total + (h.pred | float)
%}
{% endif %}
{% endfor %}
{% set diff_total = actual - ns.pred_total %}
{% set accuracy_total = (100 - ((diff_total | abs) /
ns.pred_total * 100)) if ns.pred_total != 0 else 0 %}
{% set accuracy_total = [accuracy_total, 0] | max %}
{# ===================== BIS JETZT =====================
#}
{% set current_hour = now().hour %}
{% set ns_now = namespace(actual_now=0, pred_now=0) %}
{% for h in data %}
{% if h.hour < current_hour %}
{% if h.actual is not none %}
{% set ns_now.actual_now = ns_now.actual_now + (h.actual
| float) %}
{% endif %}
{% if h.pred is not none %}
{% set ns_now.pred_now = ns_now.pred_now + (h.pred |
float) %}
{% endif %}
{% endif %}
{% endfor %}
{% set diff_now = ns_now.actual_now - ns_now.pred_now %}
{% set accuracy_now = (100 - ((diff_now | abs) /
ns_now.pred_now * 100)) if ns_now.pred_now != 0 else 0
%}
{% set accuracy_now = [accuracy_now, 0] | max %}
**📅 Tagesbasis**
<div>
⚡ Ist: {{ actual | round(2) }} kWh
📊 Differenz: {{ diff_total | round(2) }} kWh
</div>
<div>
📈 Prognose: {{ ns.pred_total | round(2) }} kWh
🎯 Genauigkeit: {{ accuracy_total | round(1) }} %
</div>
{% if diff_total > 0 %}
🟢 **über Prognose**
{% else %}
🔴 **unter Prognose**
{% endif %}
---
**⏱️ Bis jetzt ({{ '%02d' | format(current_hour)
}}:00)**
<div>
⚡ Ist: {{ ns_now.actual_now | round(2) }} kWh
📊 Differenz: {{ diff_now | round(2) }} kWh
</div>
<div>
📈 Prognose: {{ ns_now.pred_now | round(2) }} kWh
🎯 Genauigkeit: {{ accuracy_now | round(1) }} %
</div>
{% if diff_now > 0 %}
🟢 **über Prognose**
{% else %}
🔴 **unter Prognose**
{% endif %}
---
## 🏆 Beste PV-Stunde
{% for h in data %}
{% if h.actual is not none %}
{% set actual_h = h.actual | float %}
{% if actual_h > ns.best_pv %}
{% set ns.best_pv = actual_h %}
{% set ns.best_hour = h.hour %}
{% endif %}
{% endif %}
{% endfor %}
🏆 **Peak:** {{ '%02d' | format(ns.best_hour) }}:00
☀️ **Ertrag:** {{ ns.best_pv | round(2) }} kWh
---
{% set ns_cum = namespace(pred_sum=0, actual_sum=0) %}
<table>
<tr>
<th>Stunde</th>
<th>Prognose</th>
<th>Ist</th>
<th>Differenz</th>
<th>Genauigkeit</th>
<th>Σ Prognose</th>
<th>Σ Ist</th>
<th>Σ Genauigkeit</th>
</tr>
{% for h in data %}
{% if h.actual is not none and h.pred is not none %}
{% set actual_h = h.actual | float %}
{% set pred_h = h.pred | float %}
{% set diff_h = actual_h - pred_h %}
{% if pred_h == 0 %}
{% set accuracy_h = 100 if actual_h == 0 else 0 %}
{% else %}
{% set accuracy_h = 100 - ((diff_h | abs) / pred_h * 100) %}
{% endif %}
{% set accuracy_h = [accuracy_h, 0] | max %}
{% set accuracy_h = [accuracy_h, 0] | max %}
{# 🔁 Kumulieren #}
{% set ns_cum.pred_sum = ns_cum.pred_sum + pred_h %}
{% set ns_cum.actual_sum = ns_cum.actual_sum + actual_h
%}
{% set diff_cum = ns_cum.actual_sum - ns_cum.pred_sum %}
{% if ns_cum.pred_sum == 0 %}
{% set acc_cum = 100 if ns_cum.actual_sum == 0 else 0 %}
{% else %}
{% set acc_cum = 100 - ((diff_cum | abs) / ns_cum.pred_sum * 100) %}
{% endif %}
{% set acc_cum = [acc_cum, 0] | max %}
{% set acc_cum = [acc_cum, 0] | max %}
{% set icon =
'🟢' if accuracy_h >= 75 else
'🟡' if accuracy_h >= 40 else
'🔴'
%}
{% set icon_cum =
'🟢' if acc_cum >= 75 else
'🟡' if acc_cum >= 40 else
'🔴'
%}
<tr>
<td>{{ '%02d' | format(h.hour) }}:00</td>
<td>{{ pred_h | round(2) }} kWh</td>
<td>{{ actual_h | round(2) }} kWh</td>
<td>{{ diff_h | round(2) }} kWh</td>
<td>{{ icon }} {{ accuracy_h | round(1) }} %</td>
<td>{{ ns_cum.pred_sum | round(2) }} kWh</td>
<td>{{ ns_cum.actual_sum | round(2) }} kWh</td>
<td>{{ icon_cum }} {{ acc_cum | round(1) }} %</td>
</tr>
{% endif %}
{% endfor %}
</table>
text_only: true
card_mod:
style: |
ha-card {
background: transparent;
border: none;
#padding-left: 110px;
font-size: 12px;
}
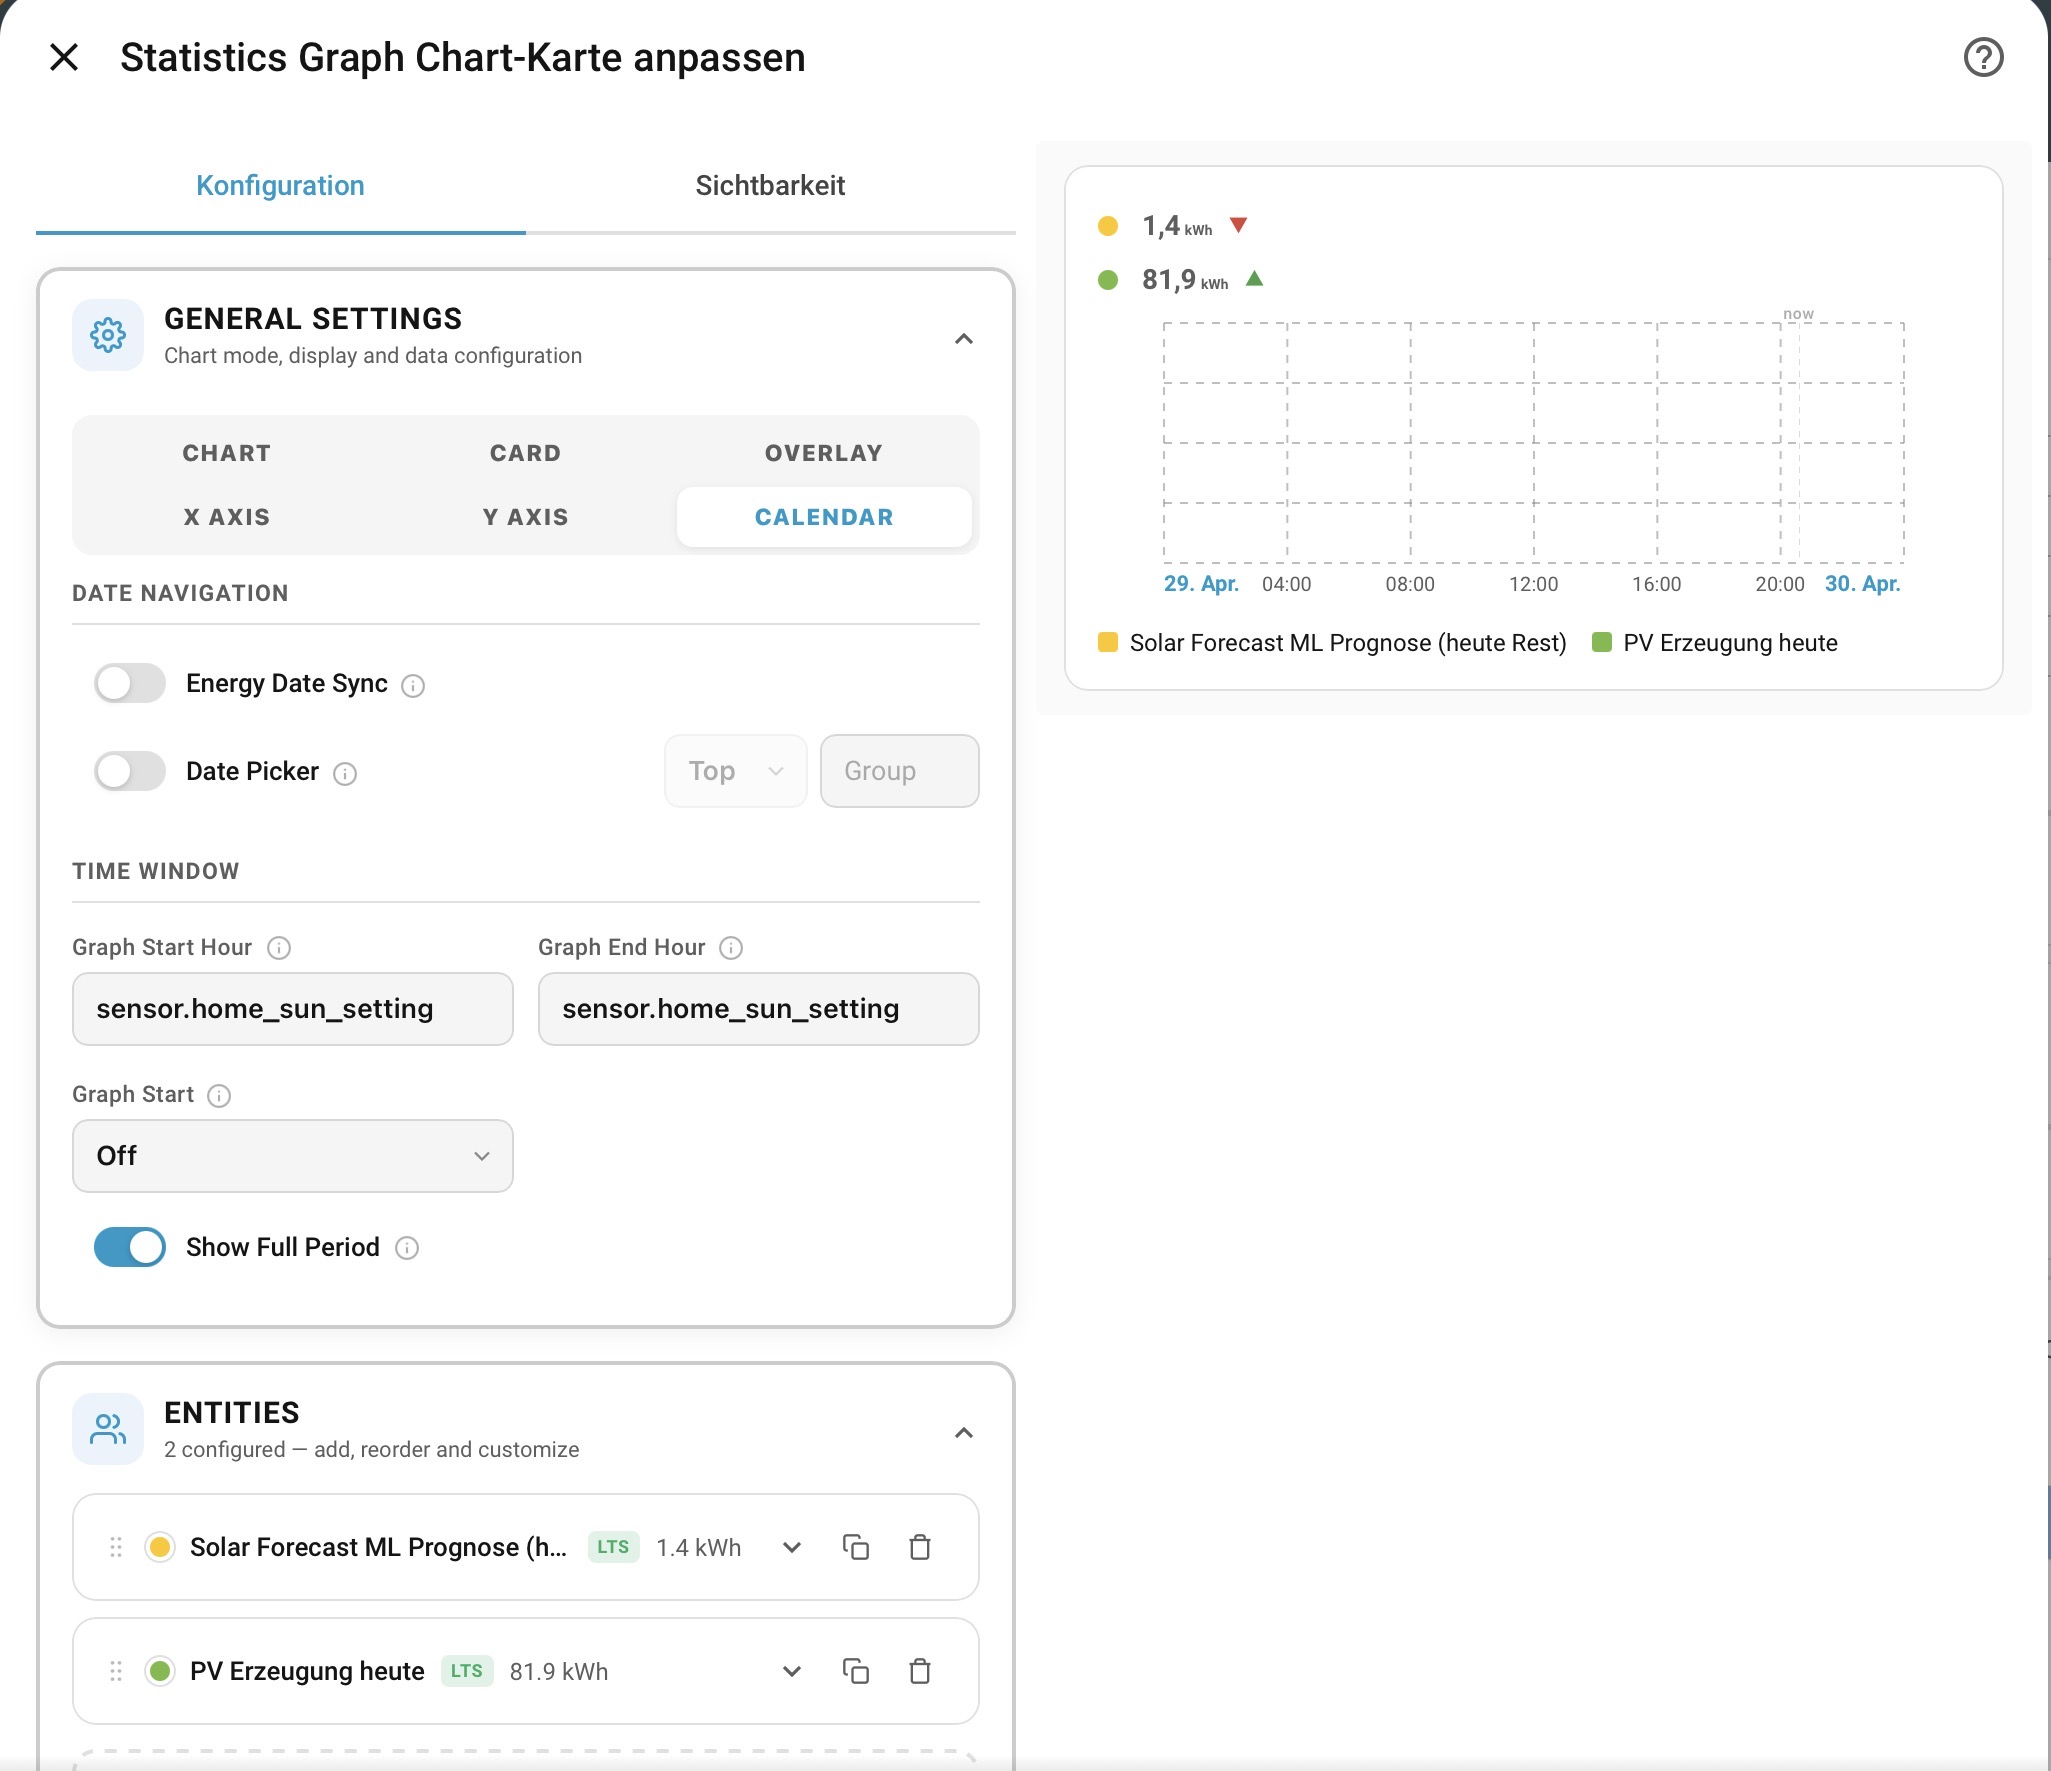
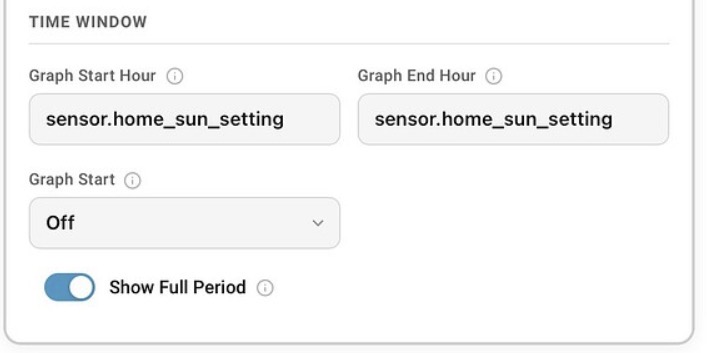
Ihr braucht nur ganz oben den Sensor eurer Wahl einzutragen (Zeile 7)