Das ganz ist nicht auf meinen Mist gewachsen … ich habe nur die Apex von Burkard etwas angepasst. Der Dank geht also an Burkard. Der ursprüngliche Beitrag ist hier:
[image]
Guten Abend allerseits,
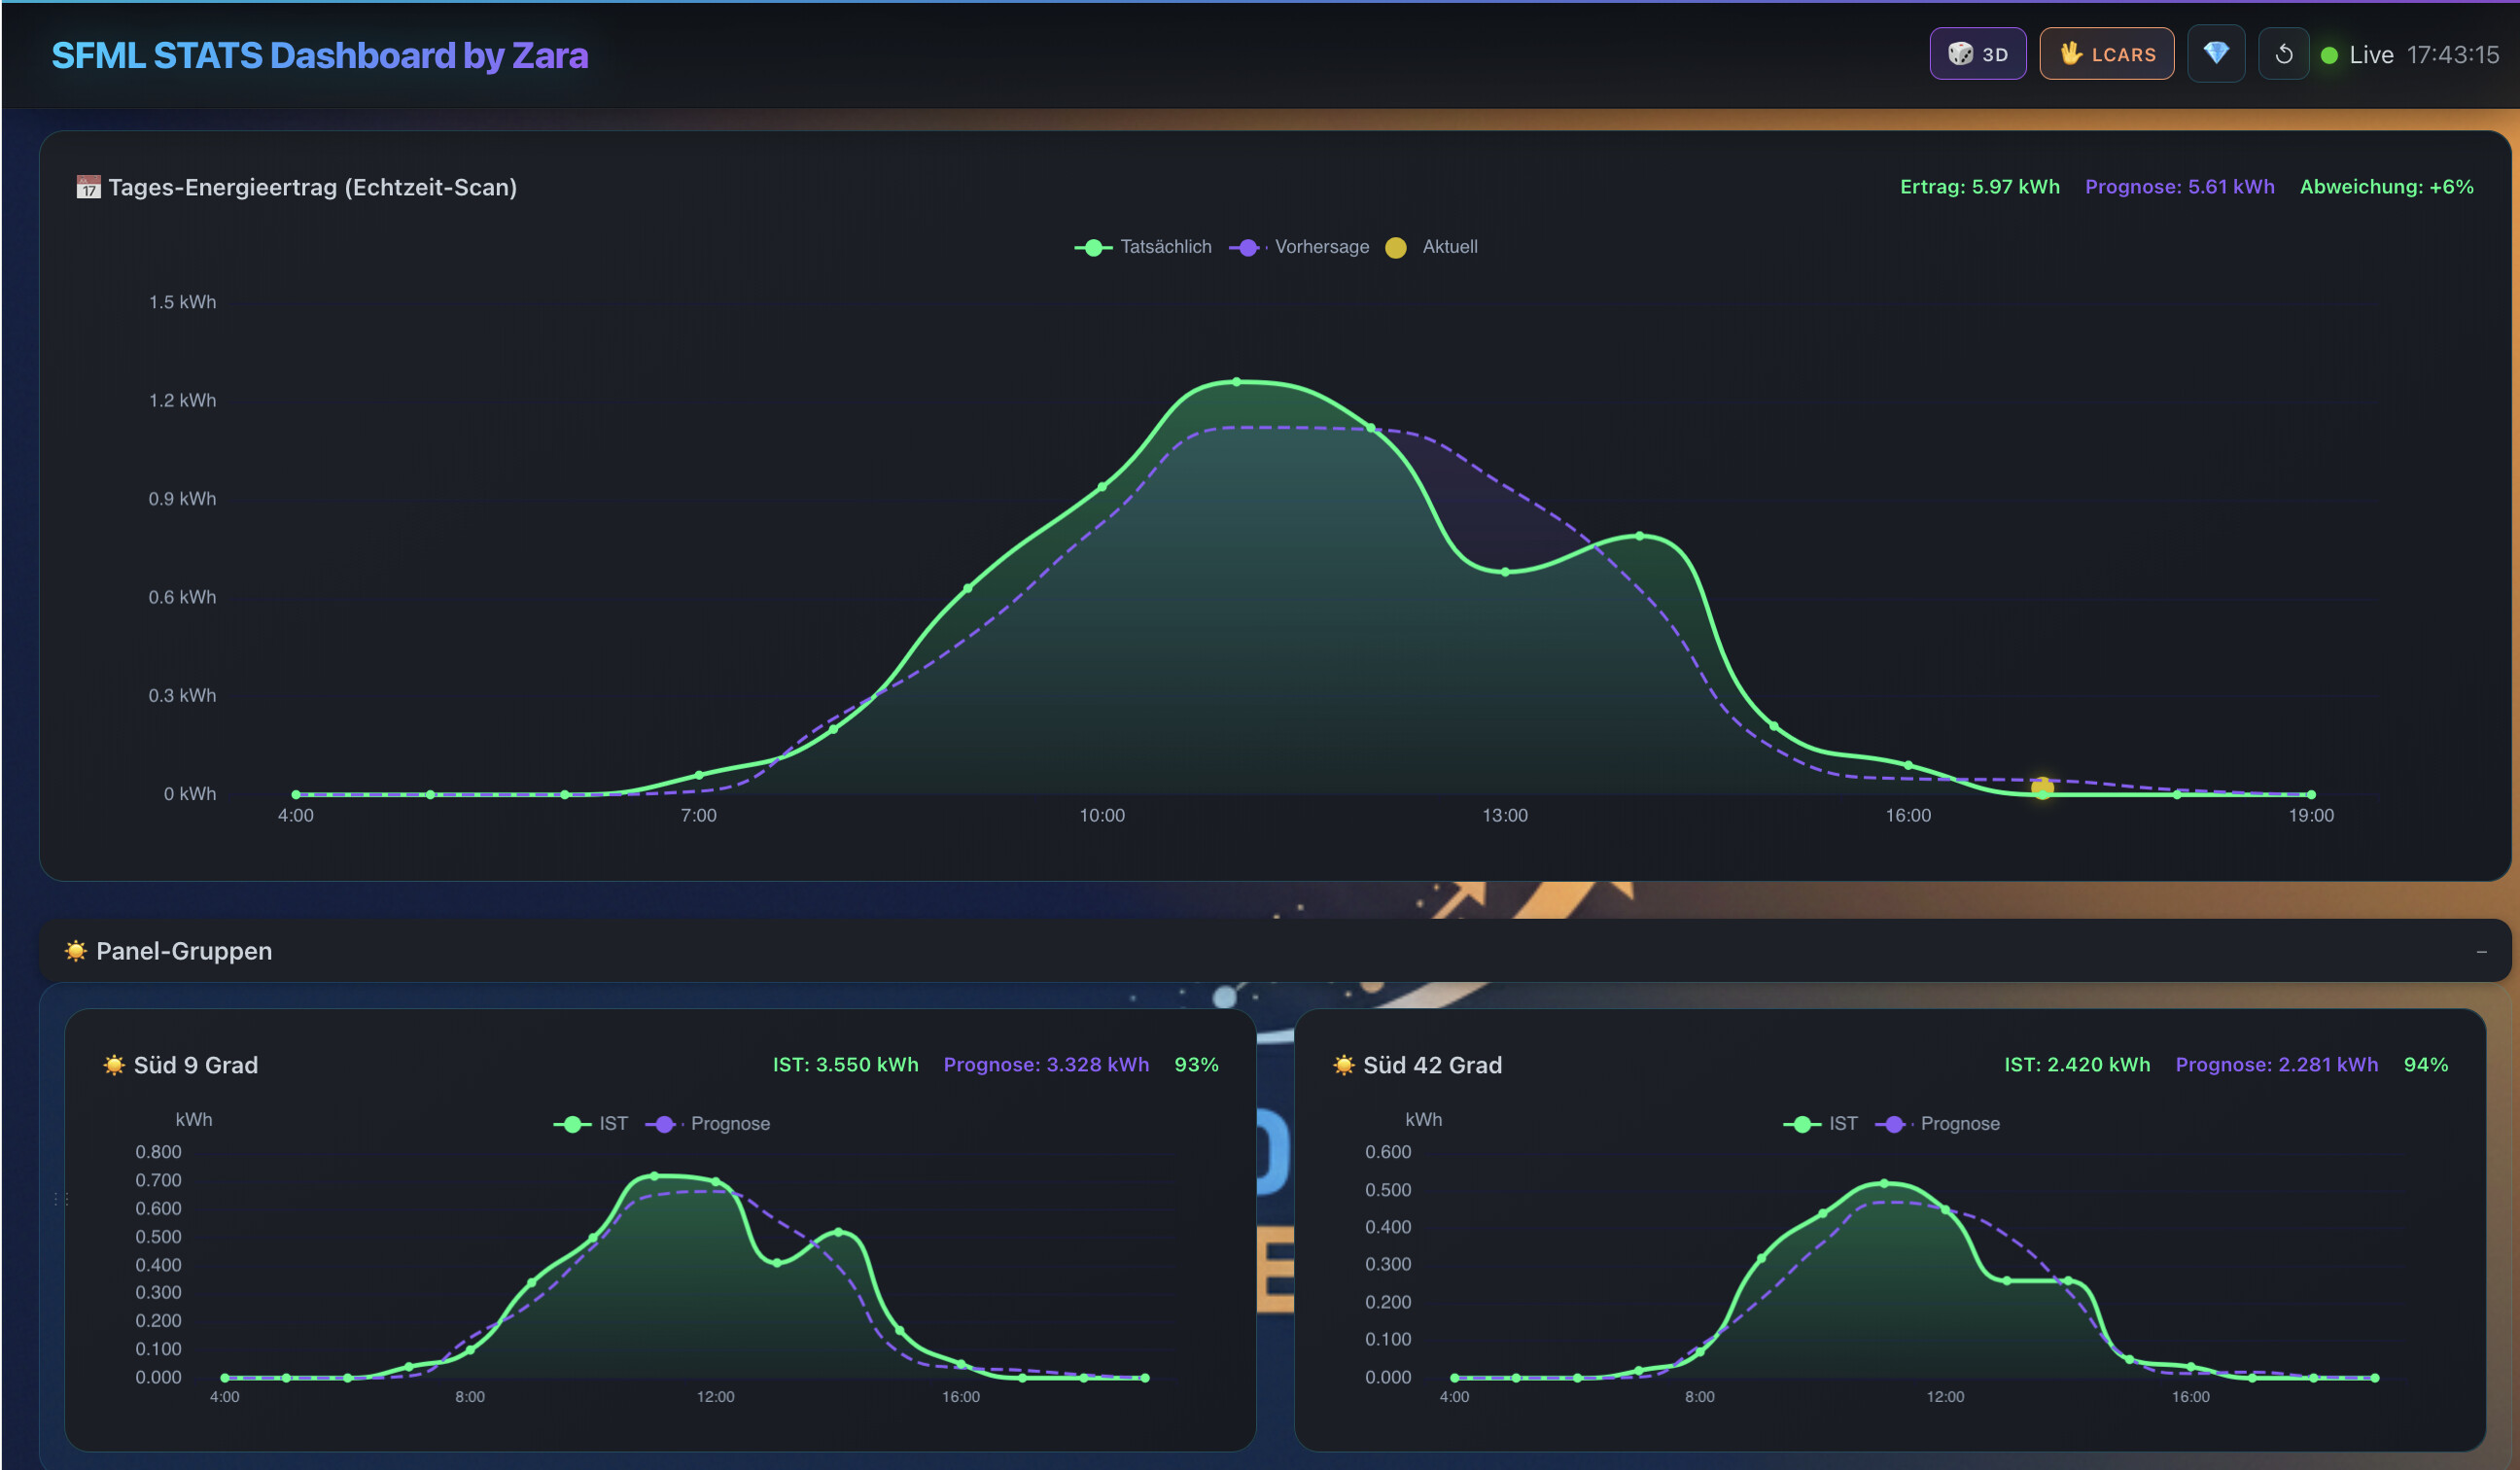
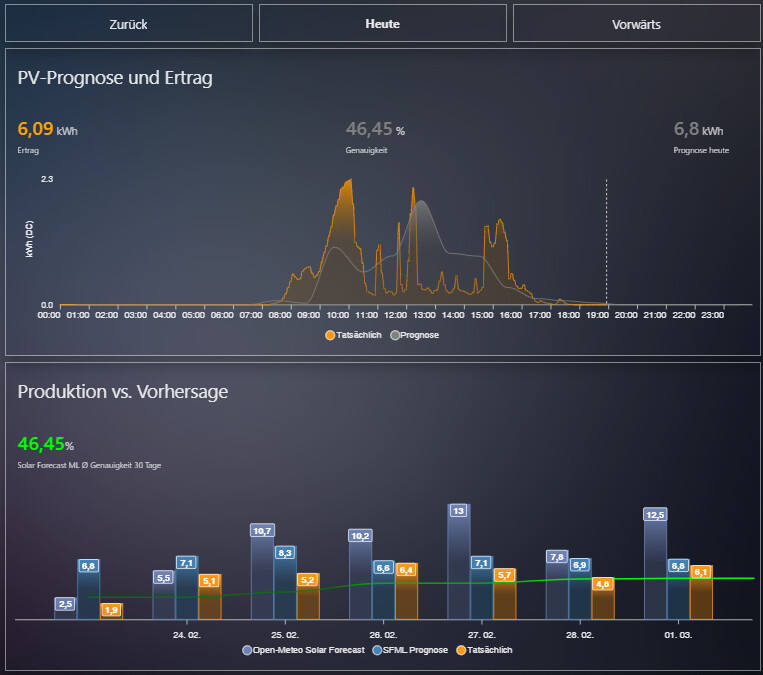
ich habe nochmal etwas an meinen Prognose-IST-Kurven herumgeflext. Jetzt kann man sich nicht nur den heutigen Tag, sondern auch die Vortage anschauen. Sämtliche Daten stammen aus der SFML-Datenbank von Tom. Mein Tool ist besonders für diejenigen von Euch interessant, die SFML-STATS mangels passender Hardware nicht betreiben können. Ihr findet es hier .
Euch einen schönen Abend
Burkard
Aber hier mein Code:
type: vertical-stack
cards:
- type: horizontal-stack
cards:
- type: custom:button-card
icon: mdi:chevron-left
name: Zurück
styles:
card:
- height: 50px
tap_action:
action: call-service
service: input_number.increment
service_data:
entity_id: input_number.sfml_day_offset
- type: custom:button-card
entity: sensor.sfml_display_date
show_icon: false
show_name: true
name: "[[[ return states['sensor.sfml_display_date'].state; ]]]"
styles:
card:
- height: 50px
name:
- font-size: 16px
- font-weight: bold
tap_action:
action: call-service
service: input_number.set_value
service_data:
entity_id: input_number.sfml_day_offset
value: 0
- type: custom:button-card
icon: mdi:chevron-right
name: Vorwärts
styles:
card:
- height: 50px
tap_action:
action: call-service
service: input_number.decrement
service_data:
entity_id: input_number.sfml_day_offset
- type: conditional
conditions:
- condition: numeric_state
entity: input_number.sfml_day_offset
below: 1
card:
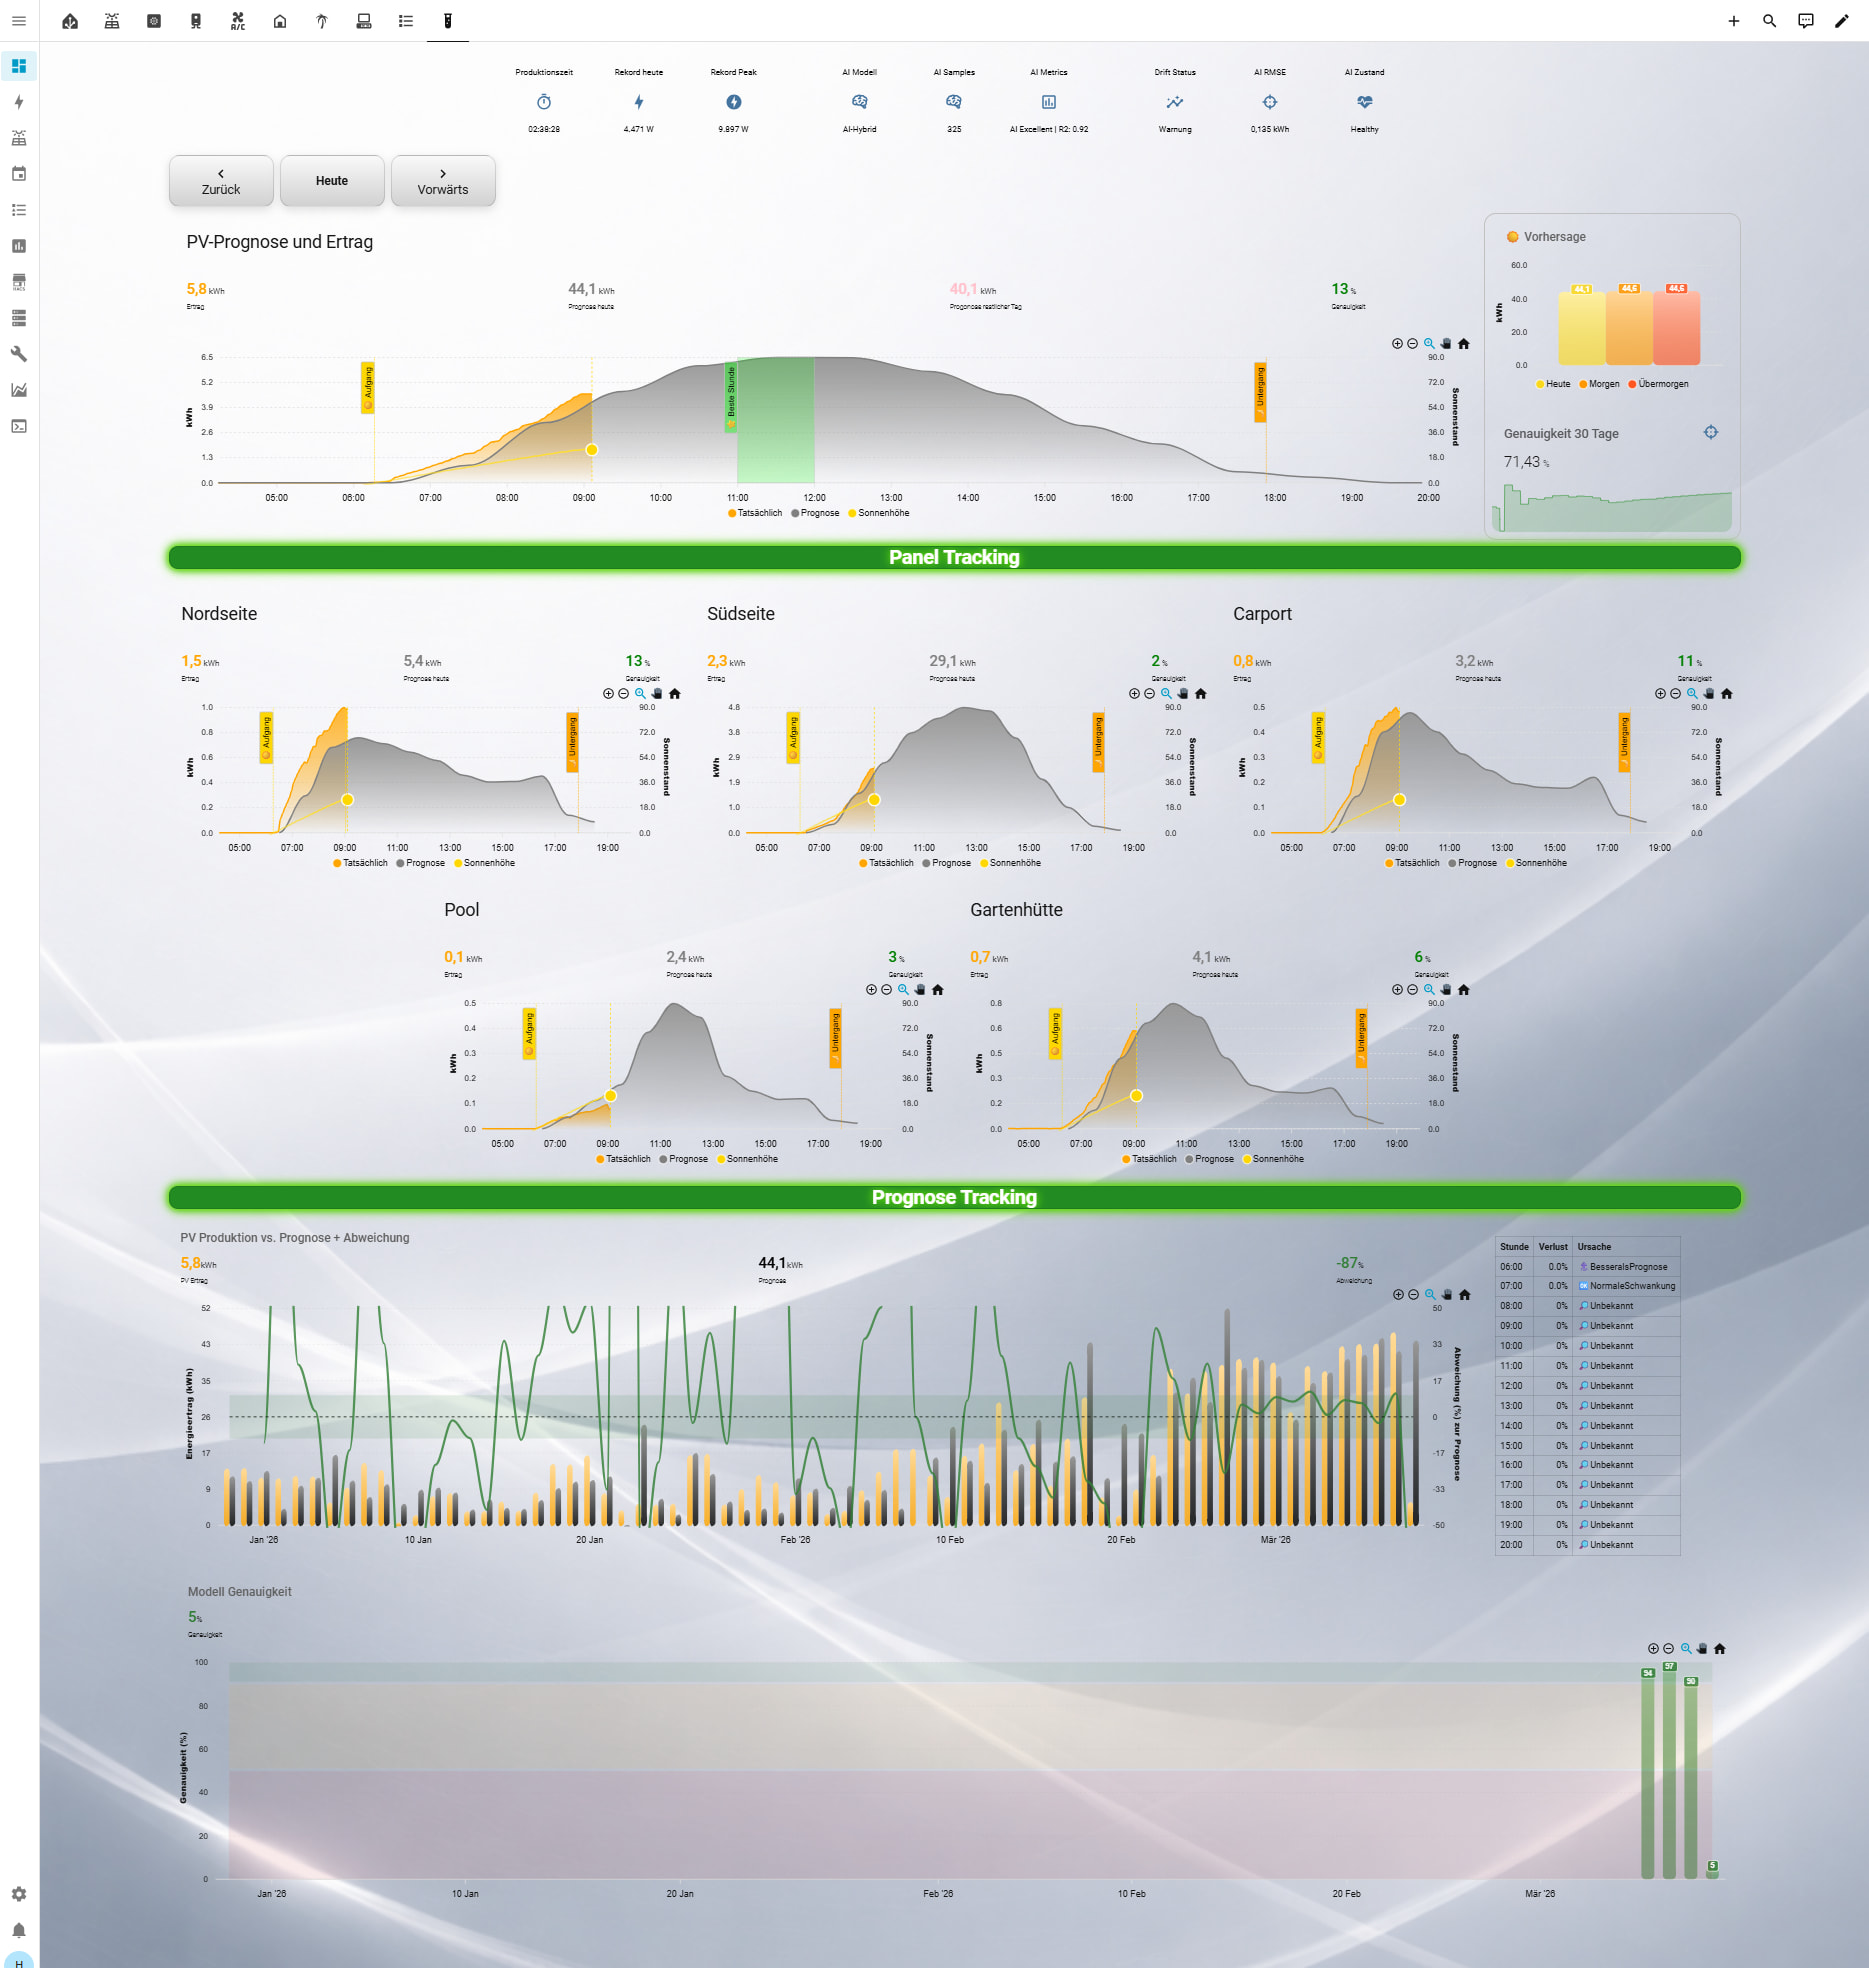
type: custom:apexcharts-card
grid_options:
columns: full
header:
title: PV-Prognose und Ertrag
show: true
standard_format: true
show_states: true
colorize_states: true
apex_config:
grid:
yaxis:
lines:
show: false
xaxis:
labels:
hideOverlappingLabels: true
rotate: 0
rotateAlways: true
showDuplicates: false
fill:
type: gradient
gradient:
type: vertical
shadeIntensity: 0.5
inverseColors: false
opacityFrom: 0.9
opacityTo: 0.5
chart:
height: 250px
tooltip:
enabled: true
shared: true
followCursor: true
stroke:
dashArray:
- 0
- 5
legend:
show: true
graph_span: 0.999d
now:
show: true
color: white
span:
start: day
offset: "-0day"
all_series_config:
type: area
opacity: 0.9
stroke_width: 1
yaxis:
- id: kW
show: true
min: 0
apex_config:
tickAmount: 0
title:
text: kWh (DC)
- id: header_only
show: false
series:
- entity: sensor.pv_leistung_aktuell_gesamt
name: Tatsächlich
float_precision: 3
stroke_width: 1
opacity: 0.6
yaxis_id: kW
unit: kW
transform: return x/1000;
extend_to: now
show:
legend_value: false
in_header: false
group_by:
func: avg
duration: 5m
- entity: sensor.sfml_stats_gesamt
name: Prognose
color: grey
opacity: 0.3
stroke_width: 1
yaxis_id: kW
unit: " kWh"
extend_to: false
show:
legend_value: false
in_header: false
data_generator: |
var today = new Date();
var data = JSON.parse(entity.attributes.hourly_data);
return data.map((entry) => {
var date = new Date(today.getFullYear(), today.getMonth(), today.getDate(), entry.hour, 30);
return [date, entry.pred];
});
- entity: sensor.sf_solar_gesamt_taglich
yaxis_id: header_only
name: Ertrag
color: orange
float_precision: 3
unit: " kWh"
show:
legend_value: true
in_header: true
in_chart: false
data_generator: |
return [[new Date(), parseFloat(entity.state)]];
- entity: sensor.solar_forecast_ml_o_genauigkeit_30_tage
yaxis_id: header_only
name: Genauigkeit
color: grey
float_precision: 3
unit: " %"
show:
legend_value: true
in_header: true
in_chart: false
- entity: sensor.sfml_stats_gesamt
yaxis_id: header_only
name: Prognose heute
color: grey
float_precision: 3
unit: " kWh"
show:
legend_value: true
in_header: true
in_chart: false
data_generator: |
return [[new Date(), entity.attributes.prediction_total]];
- type: conditional
conditions:
- condition: numeric_state
entity: input_number.sfml_day_offset
above: 0
card:
type: custom:apexcharts-card
grid_options:
columns: full
header:
title: PV-Prognose und Ertrag
show: true
standard_format: true
show_states: true
colorize_states: true
apex_config:
grid:
yaxis:
lines:
show: false
xaxis:
labels:
hideOverlappingLabels: true
rotate: 0
rotateAlways: true
showDuplicates: false
fill:
type: gradient
gradient:
type: vertical
shadeIntensity: 0.5
inverseColors: false
opacityFrom: 0.9
opacityTo: 0.5
chart:
height: 250px
tooltip:
enabled: true
shared: true
followCursor: true
stroke:
dashArray:
- 0
- 5
legend:
show: true
graph_span: 0.999d
span:
start: day
all_series_config:
type: area
opacity: 0.9
stroke_width: 2
yaxis:
- id: kW
show: true
min: 0
apex_config:
tickAmount: 5
title:
text: kWh (DC)
- id: header_only
show: false
series:
- entity: sensor.sfml_stats_gesamt_history
name: Tatsächlich
color: orange
stroke_width: 1
opacity: 0.6
yaxis_id: kW
unit: kW
extend_to: false
show:
legend_value: false
in_header: false
data_generator: >
var offset =
parseInt(hass.states['input_number.sfml_day_offset']?.state || '0');
var sel = new Date(); sel.setDate(sel.getDate() - offset);
var pad = n => String(n).padStart(2,'0');
var dk = sel.getFullYear() + '-' + pad(sel.getMonth()+1) + '-' +
pad(sel.getDate());
var now = new Date(); var y = now.getFullYear(), m = now.getMonth(),
d = now.getDate();
var attr = entity.attributes.history_data;
var hist = typeof attr === 'string' ? JSON.parse(attr) : attr;
var day = hist ? hist[dk] : null;
if (!day) return [[new Date(y,m,d,0,0),0],[new
Date(y,m,d,23,59),0]];
day = typeof day === 'string' ? JSON.parse(day) : day;
var pts = [[new Date(y,m,d,0,0),0]];
day.forEach(function(e) { if (e.actual !== null && e.actual !==
undefined) pts.push([new Date(y,m,d,e.hour,30), e.actual]); });
pts.push([new Date(y,m,d,23,59),0]);
return pts;
- entity: sensor.sfml_stats_gesamt_history
name: Prognose
color: grey
opacity: 0.3
stroke_width: 1
yaxis_id: kW
unit: " kWh"
extend_to: false
show:
legend_value: false
in_header: false
data_generator: >
var offset =
parseInt(hass.states['input_number.sfml_day_offset']?.state || '0');
var sel = new Date(); sel.setDate(sel.getDate() - offset);
var pad = n => String(n).padStart(2,'0');
var dk = sel.getFullYear() + '-' + pad(sel.getMonth()+1) + '-' +
pad(sel.getDate());
var now = new Date(); var y = now.getFullYear(), m = now.getMonth(),
d = now.getDate();
var attr = entity.attributes.history_data;
var hist = typeof attr === 'string' ? JSON.parse(attr) : attr;
var day = hist ? hist[dk] : null;
if (!day) return [[new Date(y,m,d,0,0),0],[new
Date(y,m,d,23,59),0]];
day = typeof day === 'string' ? JSON.parse(day) : day;
var pts = [[new Date(y,m,d,0,0),0]];
day.forEach(function(e) { pts.push([new Date(y,m,d,e.hour,30),
e.pred]); });
pts.push([new Date(y,m,d,23,59),0]);
return pts;
- entity: sensor.sfml_stats_gesamt_history
yaxis_id: header_only
name: Ertrag
color: orange
float_precision: 1
unit: " kWh"
show:
legend_value: true
in_header: true
in_chart: false
data_generator: >
var offset =
parseInt(hass.states['input_number.sfml_day_offset']?.state || '0');
var sel = new Date(); sel.setDate(sel.getDate() - offset);
var pad = n => String(n).padStart(2,'0');
var dk = sel.getFullYear() + '-' + pad(sel.getMonth()+1) + '-' +
pad(sel.getDate());
var attr = entity.attributes.history_data;
var hist = typeof attr === 'string' ? JSON.parse(attr) : attr;
var day = hist ? hist[dk] : null;
if (!day) return [[new Date(), 0]];
day = typeof day === 'string' ? JSON.parse(day) : day;
var total = day.reduce(function(s,e) { return s + (e.actual || 0);
}, 0);
return [[new Date(), Math.round(total * 10) / 10]];
- entity: sensor.sfml_stats_gesamt_history
yaxis_id: header_only
name: Prognose
color: grey
float_precision: 1
unit: " kWh"
show:
legend_value: true
in_header: true
in_chart: false
data_generator: >
var offset =
parseInt(hass.states['input_number.sfml_day_offset']?.state || '0');
var sel = new Date(); sel.setDate(sel.getDate() - offset);
var pad = n => String(n).padStart(2,'0');
var dk = sel.getFullYear() + '-' + pad(sel.getMonth()+1) + '-' +
pad(sel.getDate());
var attr = entity.attributes.history_data;
var hist = typeof attr === 'string' ? JSON.parse(attr) : attr;
var day = hist ? hist[dk] : null;
if (!day) return [[new Date(), 0]];
day = typeof day === 'string' ? JSON.parse(day) : day;
var total = day.reduce(function(s,e) { return s + (e.pred || 0); },
0);
return [[new Date(), Math.round(total * 10) / 10]];
- entity: input_number.sfml_day_offset
yaxis_id: header_only
name: _trigger
show:
in_chart: false
in_header: false
legend_value: false
data_generator: |
return [];
- type: custom:apexcharts-card
grid_options:
columns: 24
header:
title: Produktion vs. Vorhersage
show: true
show_states: true
standard_format: true
colorize_states: true
apex_config:
grid:
yaxis:
lines:
show: false
xaxis:
labels:
hideOverlappingLabels: false
rotateAlways: false
showDuplicates: false
format: dd. MM.
yaxis:
tickAmount: 10
show: false
plotOptions:
bar:
columnWidth: 70%
chart:
height: 250px
legend:
show: true
showForSingleSeries: true
fill:
type: gradient
gradient:
type: vertical
shadeIntensity: 0.5
inverseColors: false
opacityFrom: 1
opacityTo: 0.8
all_series_config:
type: line
opacity: 0.1
stroke_width: 1
series:
- entity: sensor.energy_production_today_2
type: column
name: Open-Meteo Solar Forecast
color: rgb(110,130,180)
group_by:
func: max
duration: 1d
show:
legend_value: false
in_header: false
datalabels: true
- entity: sensor.prognose_heute
type: column
name: SFML Prognose
color: rgb(70,130,180)
group_by:
func: max
duration: 1d
show:
legend_value: false
in_header: false
datalabels: true
- entity: sensor.sf_solar_gesamt_taglich
type: column
name: Tatsächlich
color: rgb(255,153,28)
group_by:
func: max
duration: 1d
show:
legend_value: false
in_header: false
datalabels: true
- entity: sensor.solar_forecast_ml_o_genauigkeit_30_tage
type: line
color: rgb(0,255,0)
transform: return x/10;
stroke_width: 2
group_by:
func: min
duration: 1d
show:
legend_value: false
in_header: false
in_legend: false
- entity: sensor.solar_forecast_ml_o_genauigkeit_30_tage
type: line
color: rgb(0,255,0)
transform: return x/1;
float_precision: 3
group_by:
func: min
duration: 1d
show:
legend_value: false
in_header: true
in_legend: false
in_chart: false
graph_span: 7d
span:
start: day
offset: "-6d"
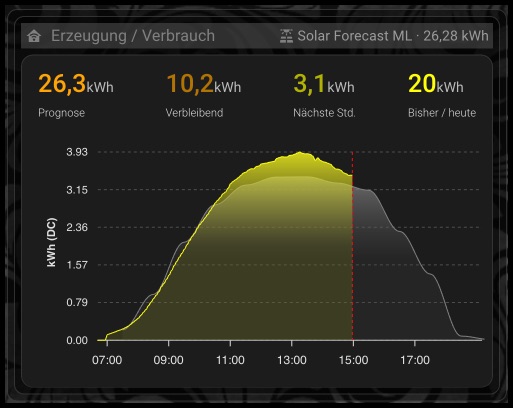
- type: custom:apexcharts-card
grid_options:
columns: full
header:
title: PV-Prognose und Messwerte (Solar Forecast ML)
show: true
standard_format: true
show_states: true
colorize_states: true
apex_config:
chart:
height: 250px
tooltip:
enabled: true
shared: true
followCursor: true
graph_span: 0.999d
now:
show: true
color: white
span:
start: day
offset: "-0day"
all_series_config:
type: area
opacity: 0.9
stroke_width: 1
yaxis:
- id: kW
show: true
min: 0
apex_config:
tickAmount: 5
title:
text: kWh (AC)
- id: header_only
show: false
series:
- entity: sensor.sf_battery_2_battery_level
name: Batterie
float_precision: 1
type: area
color: green
stroke_width: 2
opacity: 0.05
yaxis_id: kW
unit: kWh
transform: return x * 7.5 / 100;
extend_to: now
show:
legend_value: true
in_header: false
group_by:
func: last
duration: 5m
- entity: sensor.hausverbrauch_leistung
name: Verbrauch
float_precision: 3
type: area
color: red
stroke_width: 2
opacity: 0.1
yaxis_id: kW
unit: kW
transform: return x/1000;
extend_to: now
show:
legend_value: true
in_header: false
group_by:
func: avg
duration: 5m
- entity: sensor.solar_forecast_ml_power_sensor_state
name: Solarerzeugung
float_precision: 3
color: orange
stroke_width: 2
opacity: 0.6
yaxis_id: kW
unit: kW
transform: return x/1000;
extend_to: now
show:
legend_value: true
in_header: false
group_by:
func: avg
duration: 5m
- entity: sensor.sfml_tagesprognose
name: SFML Prognose
extend_to: false
color: grey
opacity: 0.3
stroke_width: 2
yaxis_id: kW
show:
legend_value: false
in_header: false
data_generator: |
var today = new Date();
var data = JSON.parse(entity.attributes.hourly_forecast);
return data.map((entry) => {
var date = new Date(today.getFullYear(), today.getMonth(), today.getDate(), entry.hour, 30);
return [date, entry.kwh];
});
- entity: sensor.sfml_tagesprognose
yaxis_id: header_only
name: Prognose heute
float_precision: 1
unit: " kWh"
show:
legend_value: true
in_header: true
in_chart: false
- entity: sensor.solar_forecast_ml_yield_sensor_state
yaxis_id: header_only
name: Heute bis jetzt
float_precision: 1
color: orange
show:
legend_value: true
in_header: true
in_chart: false
- entity: sensor.solar_forecast_ml_prognose_nachste_stunde
yaxis_id: header_only
name: Nächste Stunde
float_precision: 1
unit: " kWh"
show:
legend_value: true
in_header: true
in_chart: false
- entity: sensor.forecast_today_remaining
yaxis_id: header_only
name: Prognose heute Rest
float_precision: 1
unit: " kWh"
show:
legend_value: true
in_header: true
in_chart: false
- entity: sensor.prognose_morgen
yaxis_id: header_only
name: Prognose morgen
float_precision: 1
unit: " kWh"
show:
legend_value: true
in_header: true
in_chart: false
- entity: sensor.prognose_ubermorgen
yaxis_id: header_only
name: Prognose übermorgen
float_precision: 1
unit: " kWh"
show:
legend_value: true
in_header: true
in_chart: false
grid_options:
columns: 24
rows: auto