Der Sahara Staub ist im Westen angekommen, klarer Himmel aber ganz oben leicht verfärbt. Wenn es jetzt Regnet liegt der auf den Panelen 
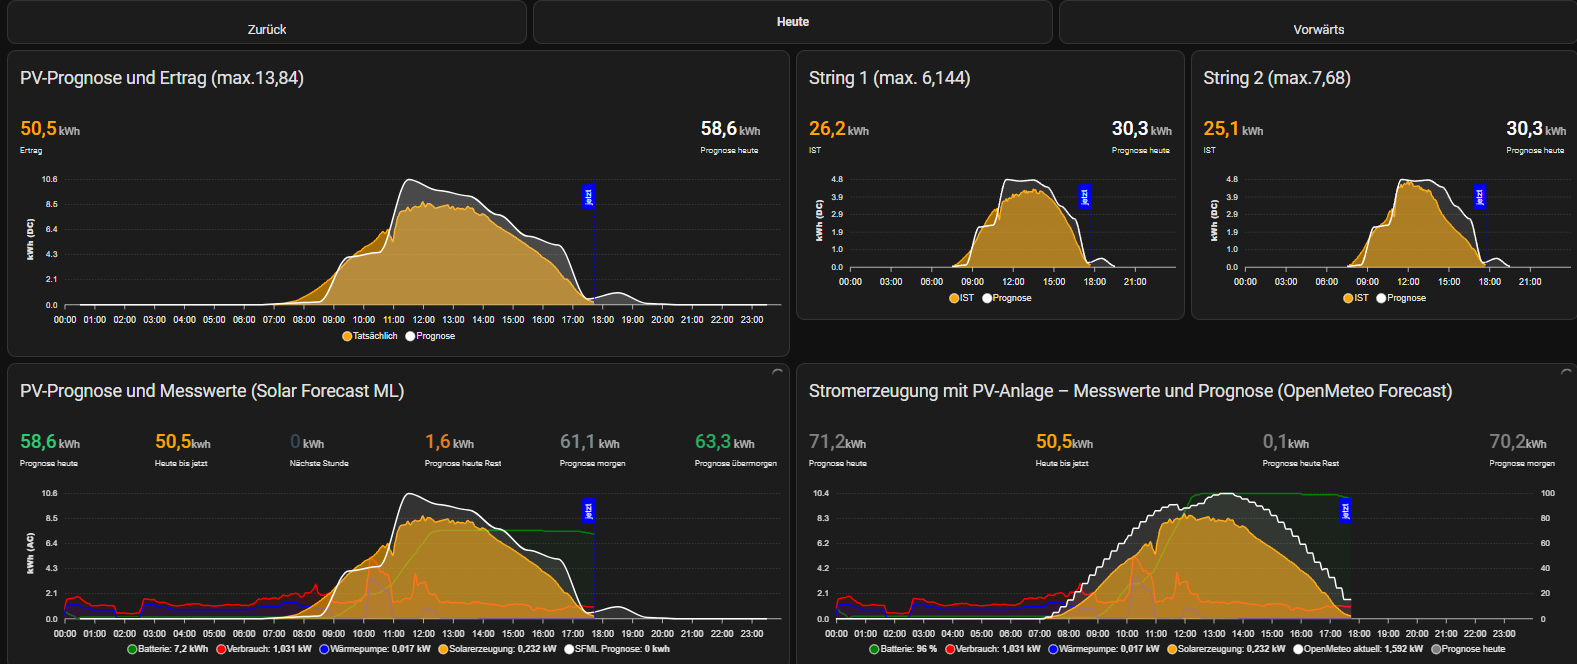

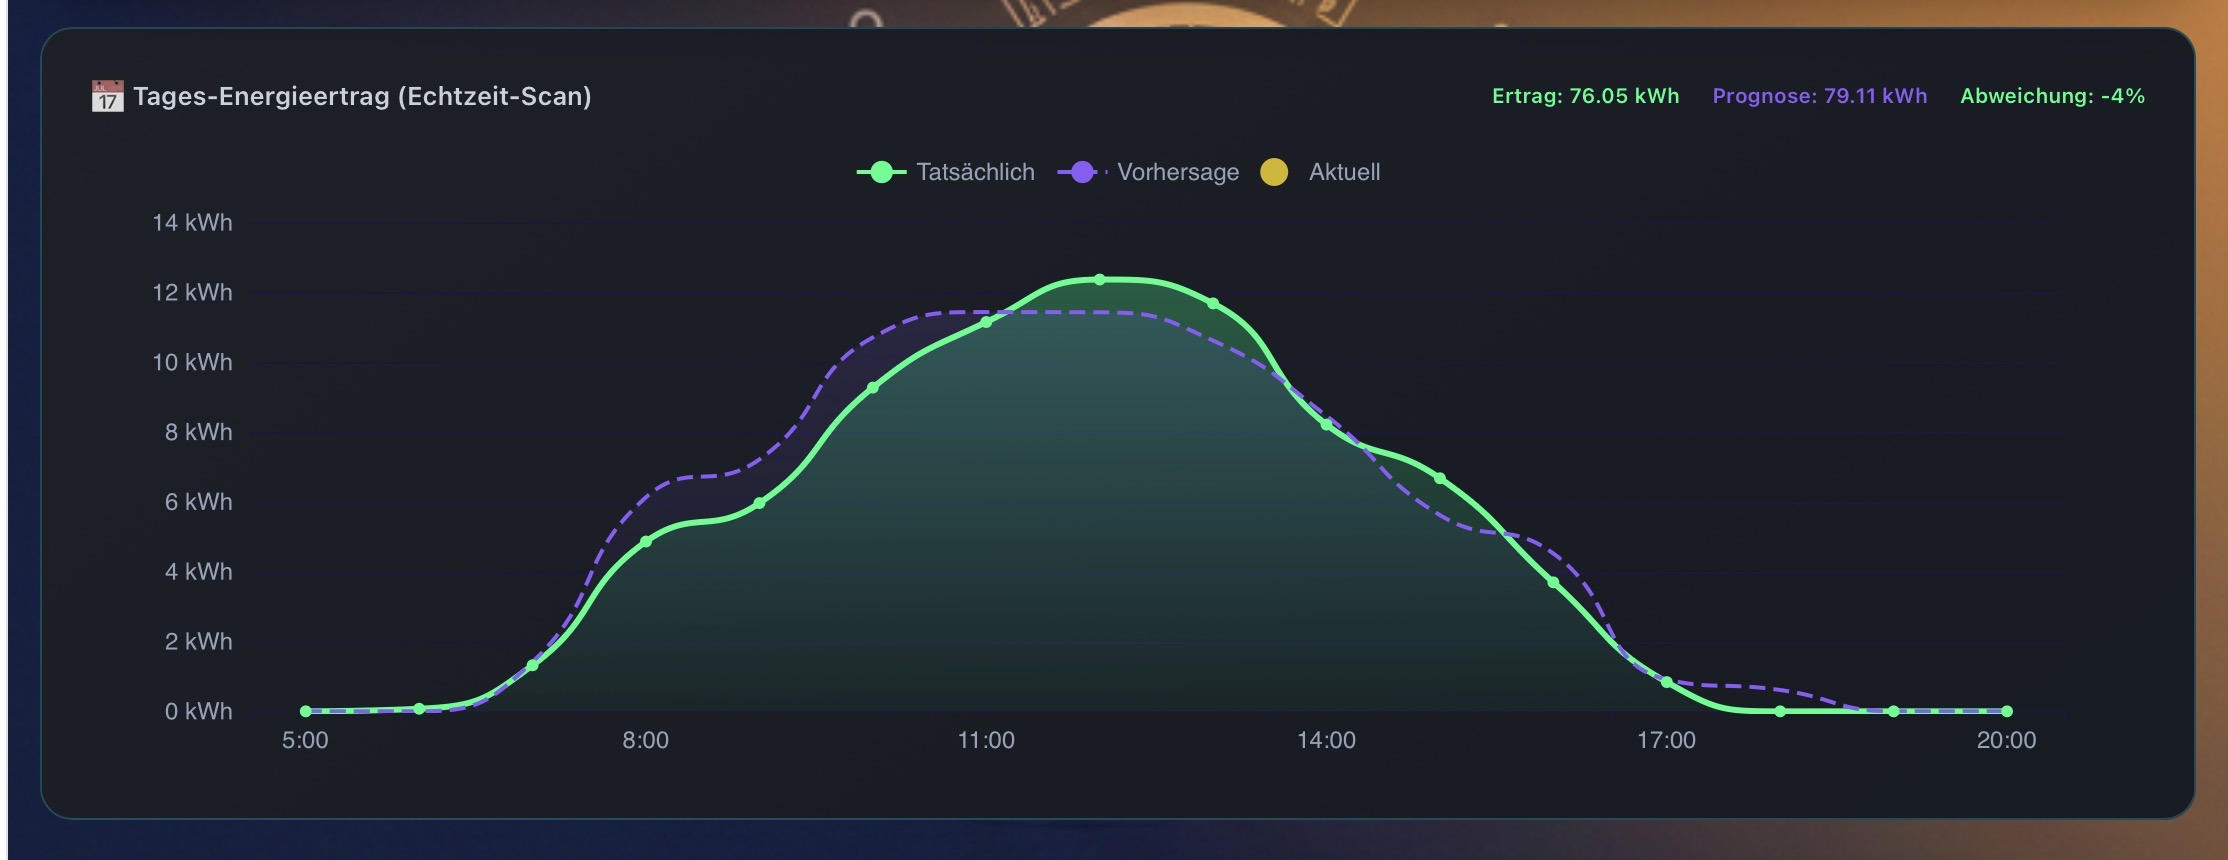
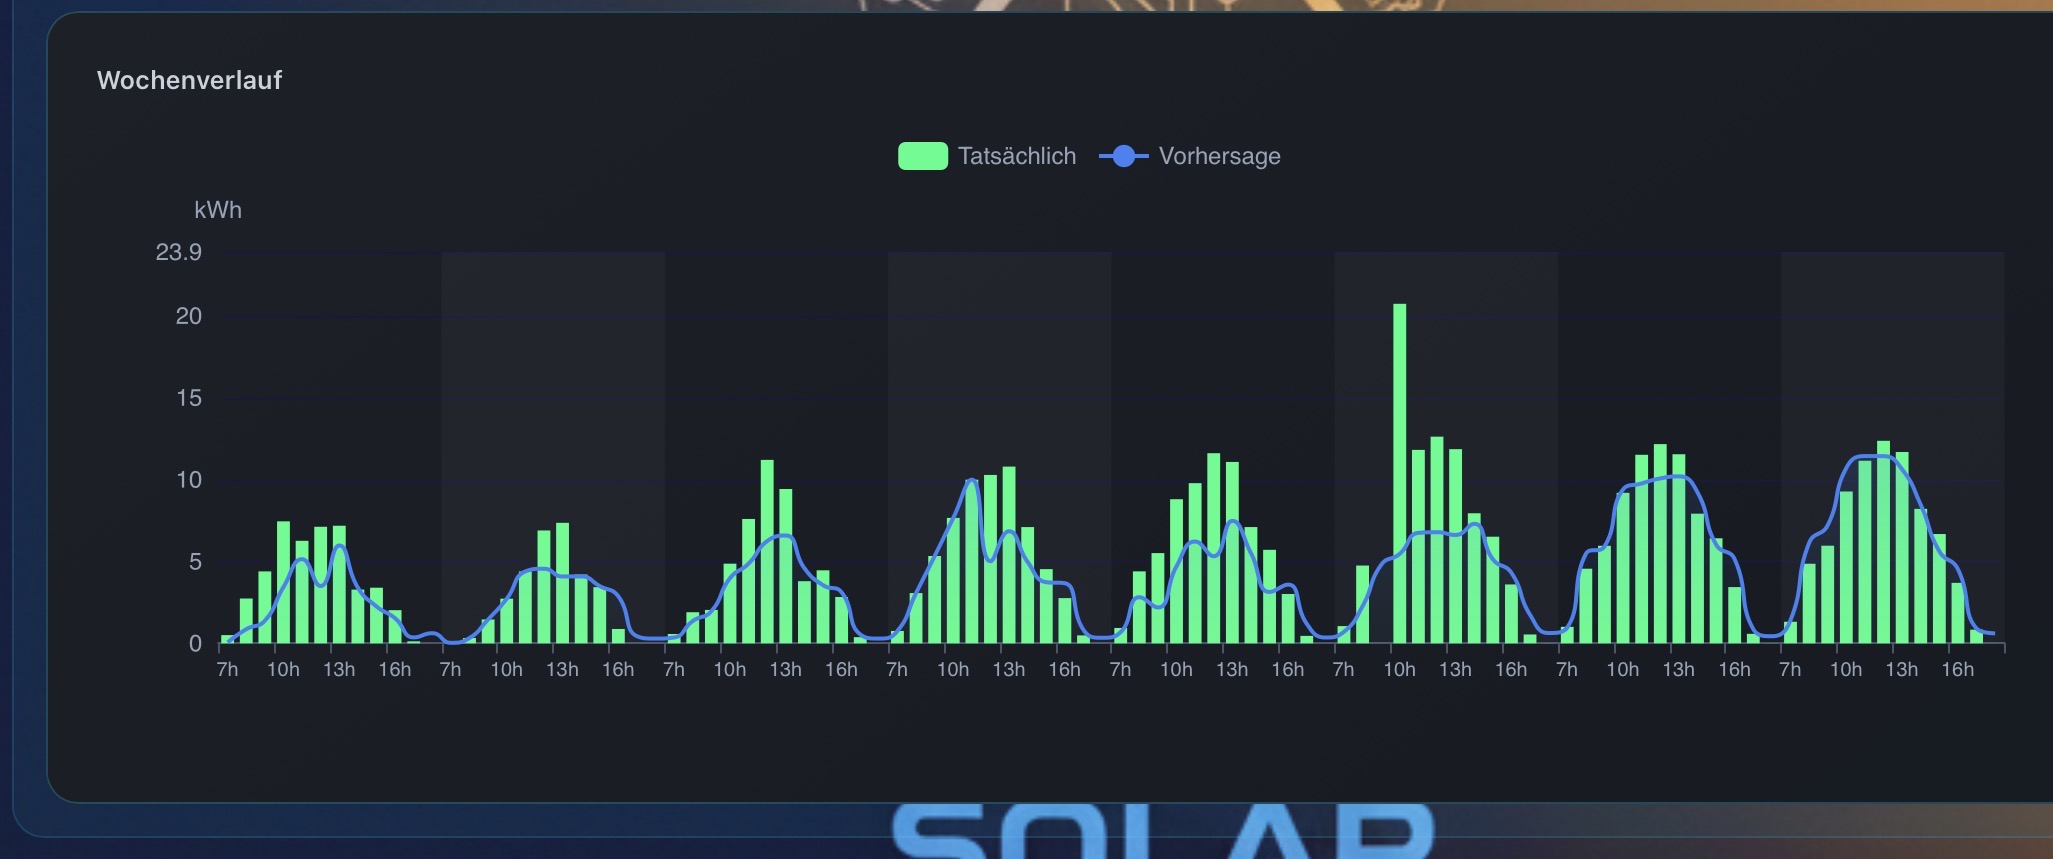

@freo Solcast mit SFML zu vergleichen oder Forcast Solar ist schon unfair!!!
Solcast und forecast Solar regeln mehrfach am Tag nach, SFML hingegen ist statisch!! Wenn du schon Solacasr vergleichen möchtest musst du die Prognose zum Zeitpunkt nehmen an dem SFML ihre erstellt hat 

Veröffentliche doch bitte mal die Prognose von SFML und Solcast von heute Morgen zum gleichen Zeitpunkt. Das würde mich wirklich mal interessieren weil ich habe kein Solcast
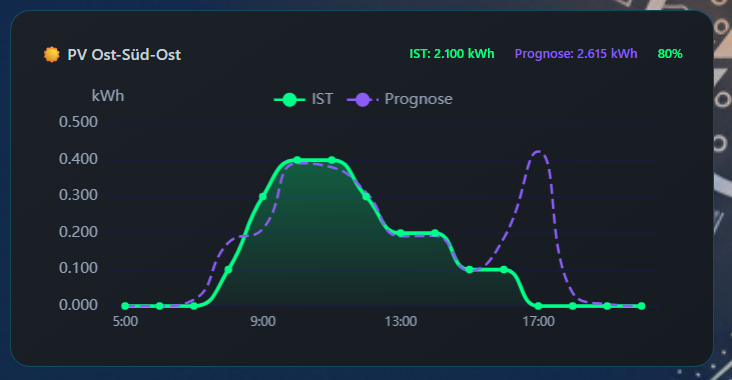
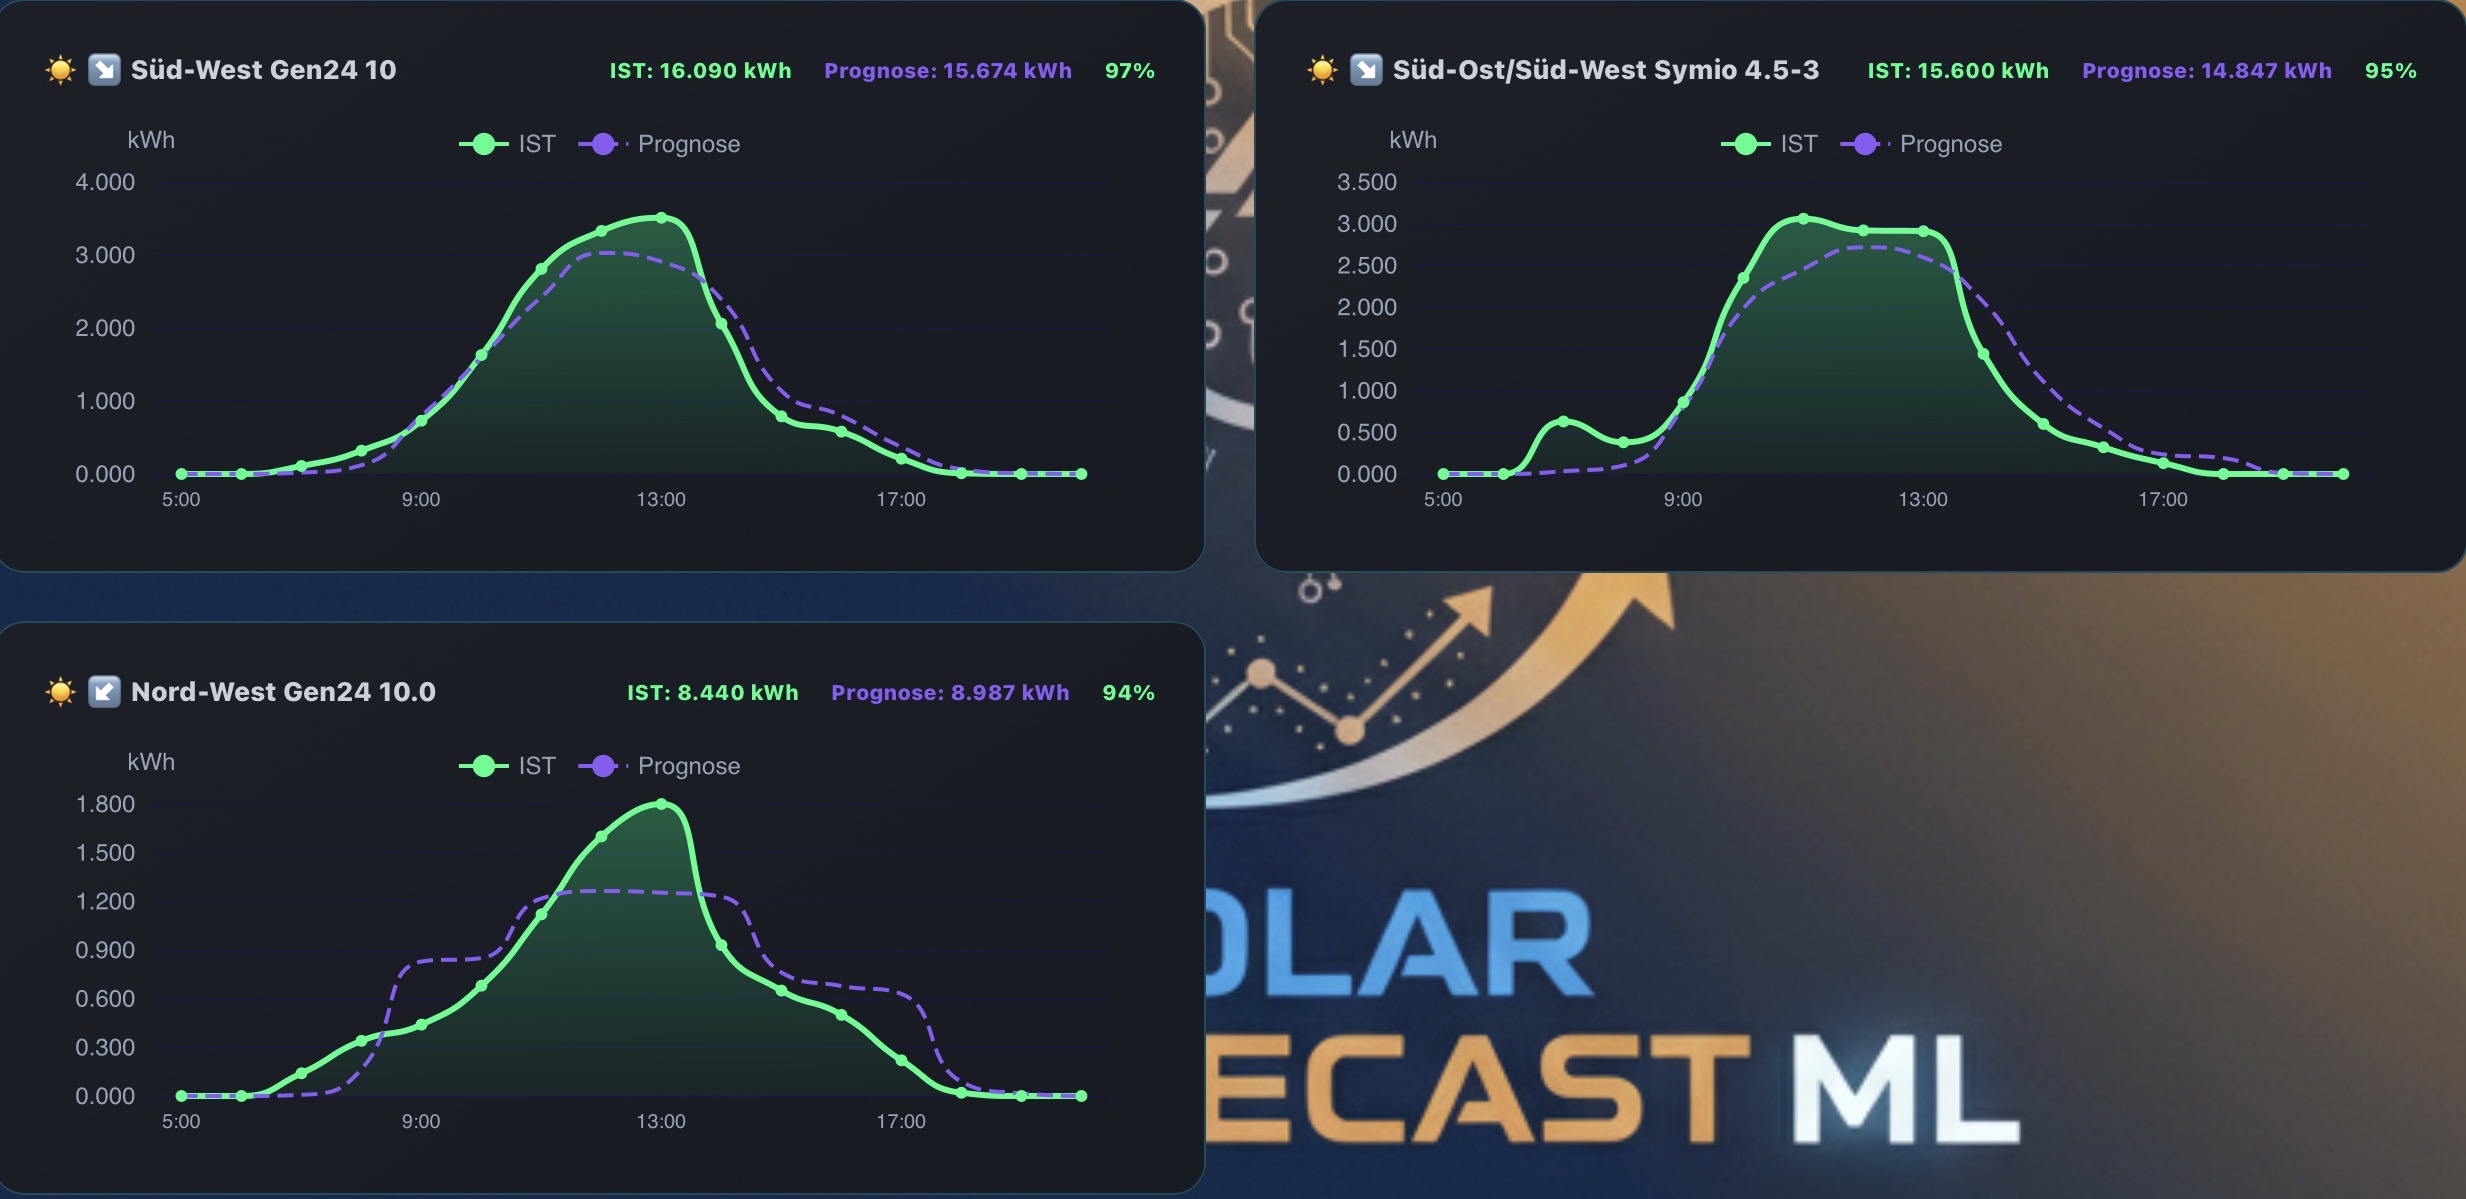
Habe den 17 Uhr Hügel wieder aber komischer weise nur noch auf den Modulen Ost Süd Ost .
Wo man um 17 Uhr sowieso keine Sonne zu erwarten hat?
Ansonsten währen es 100%
Sehr seltsam.
1 „Gefällt mir“
Heute habe ich den Hügel nicht. 
Nice der Verlauf.
1 „Gefällt mir“
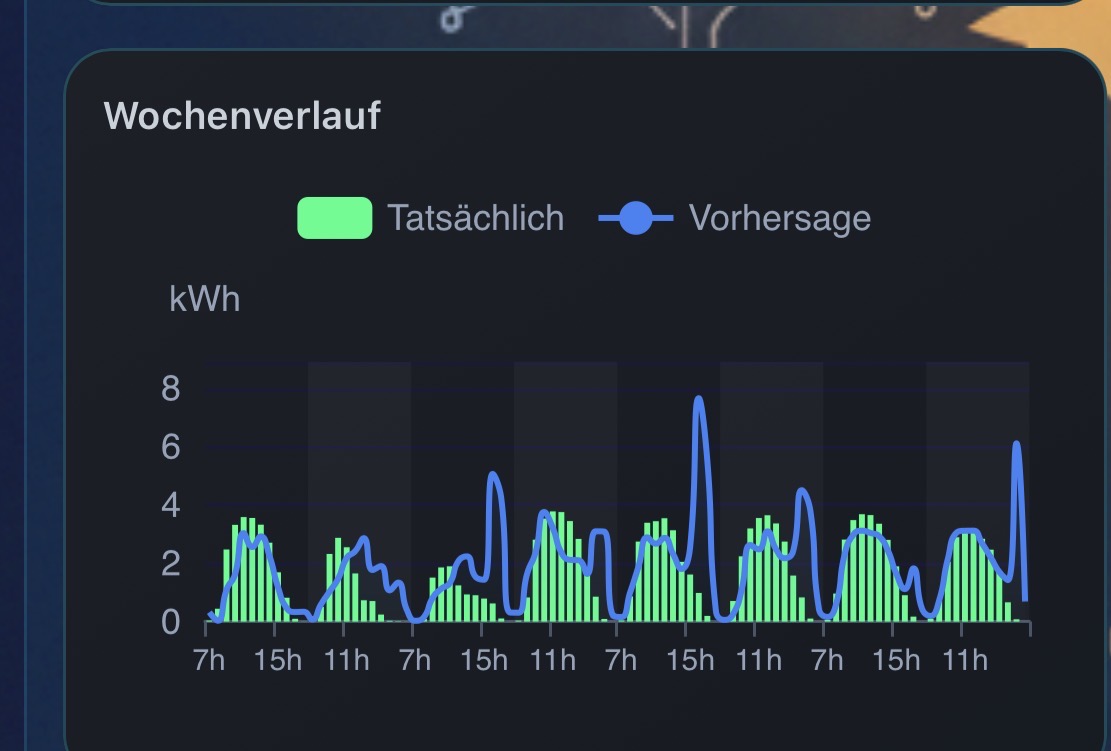
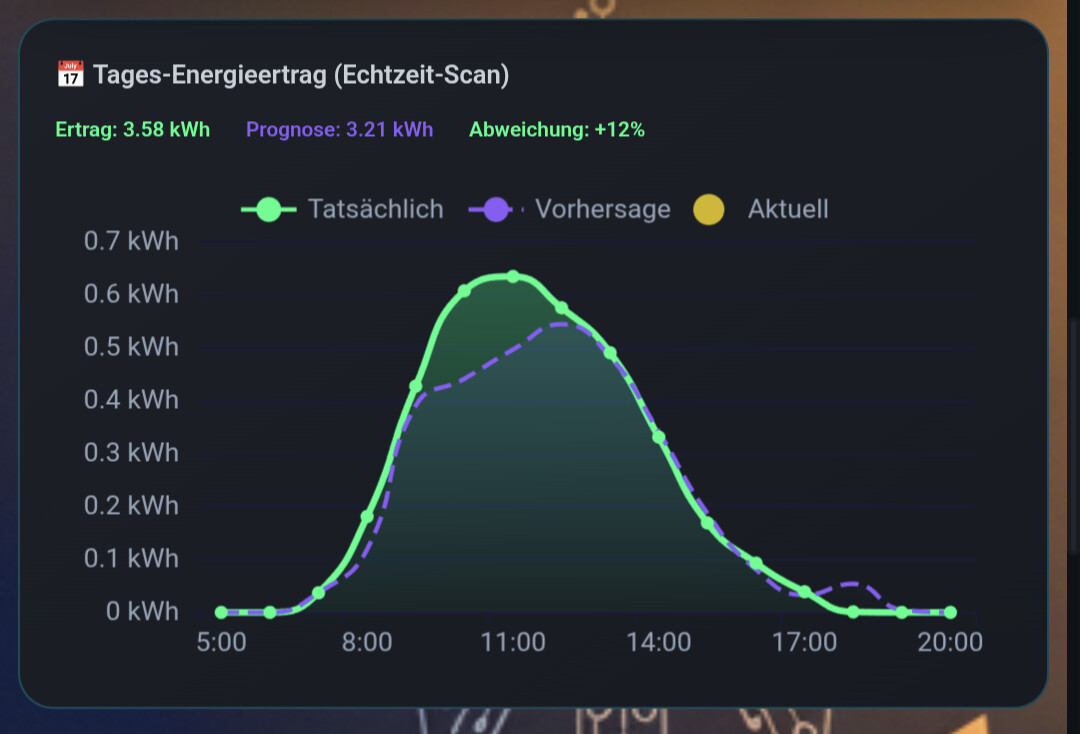
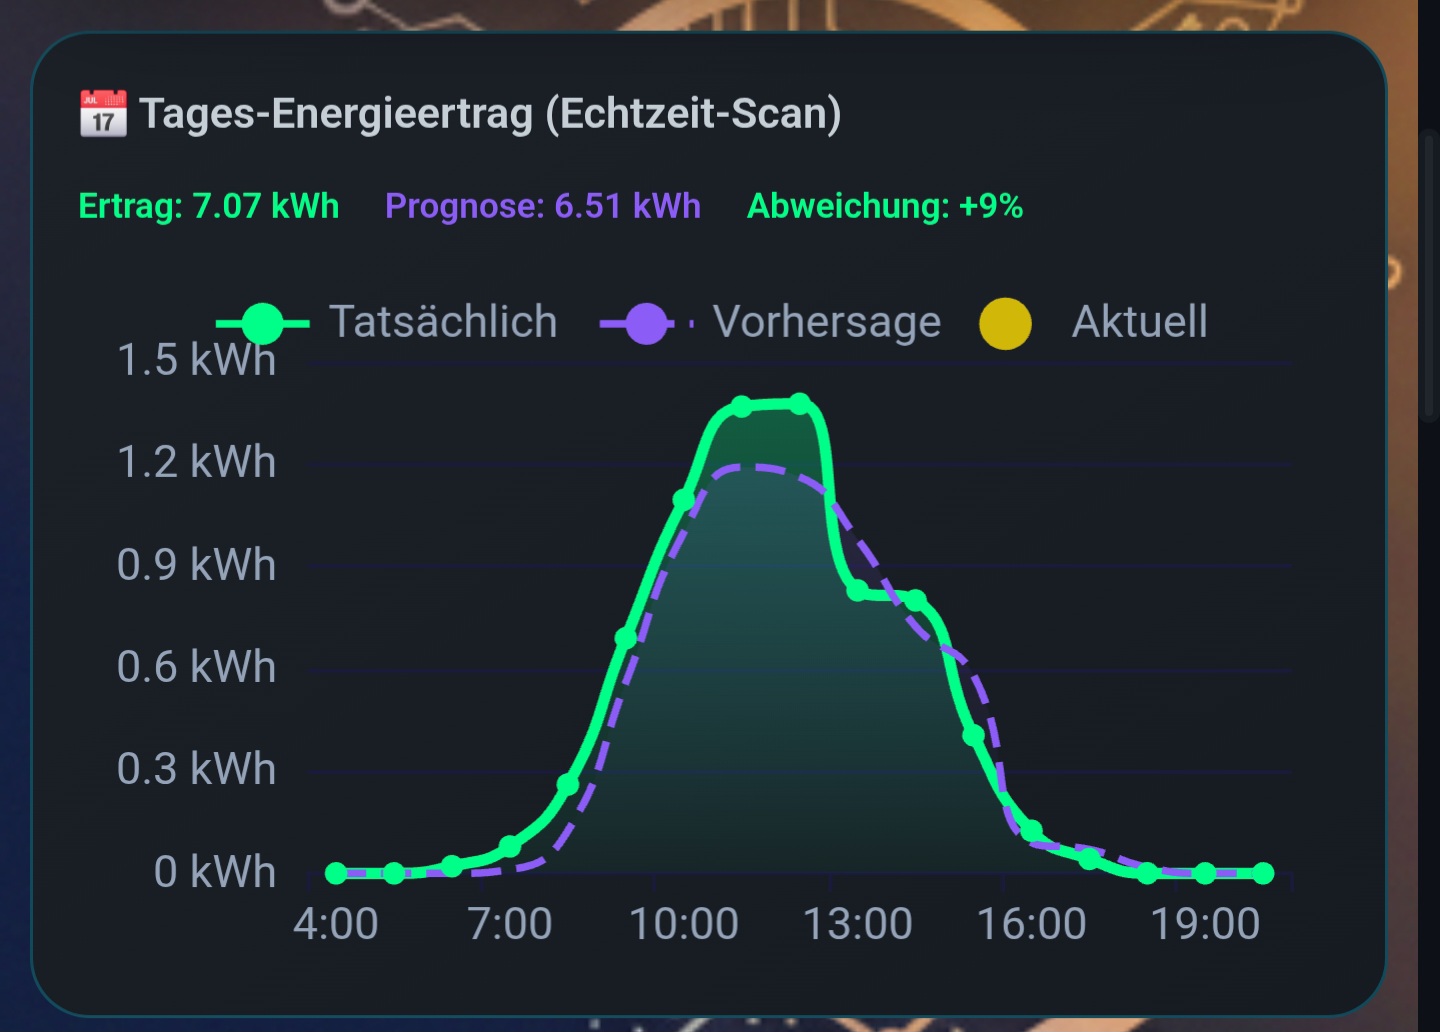
Hatte heute wieder den Hügel gegen 17 Uhr
Sonst sah/sieht es eigentlich ganz gut aus. Heute aber leider eine große DifferenZ
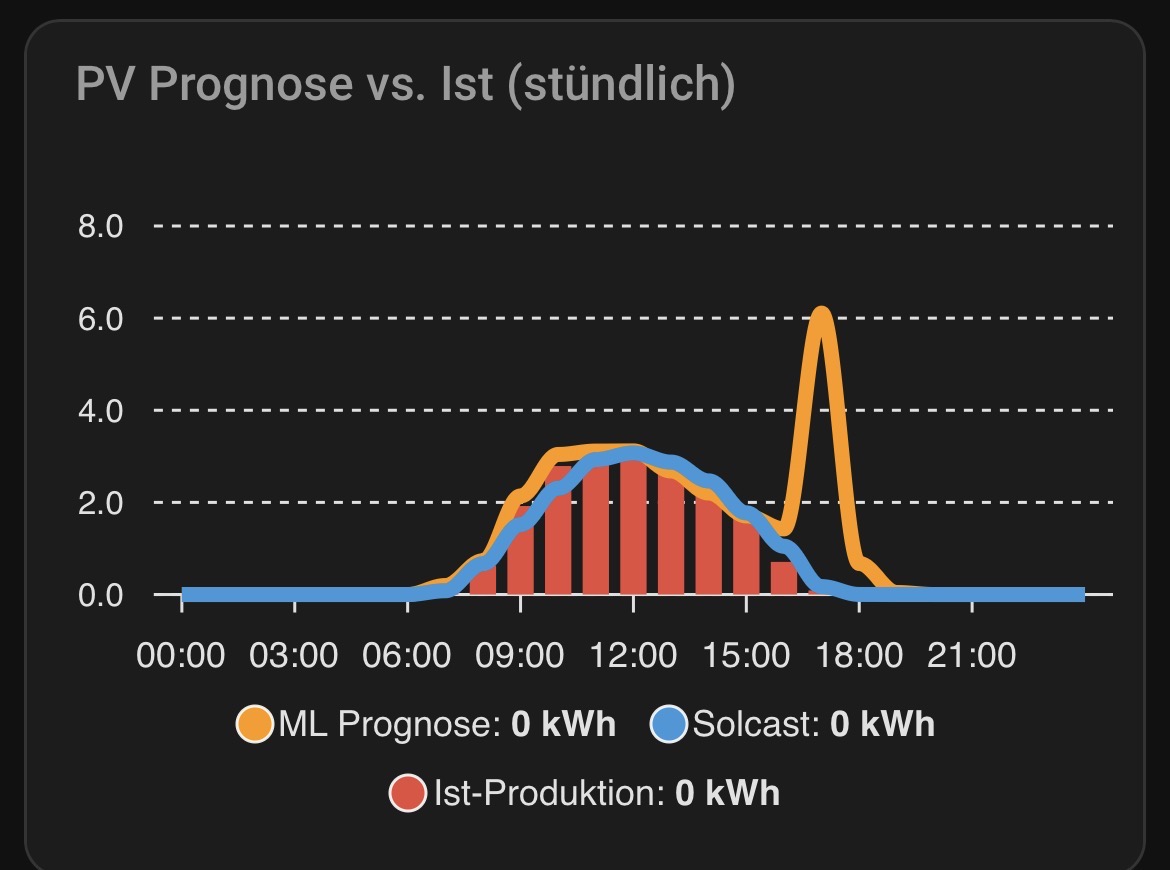
Hier einmal die Forcast von Meteo verglichen mit SFML und dem Tagesverlauf der Produktion. Mit dem Sahara-Sand kam Meteo auch nicht klar.
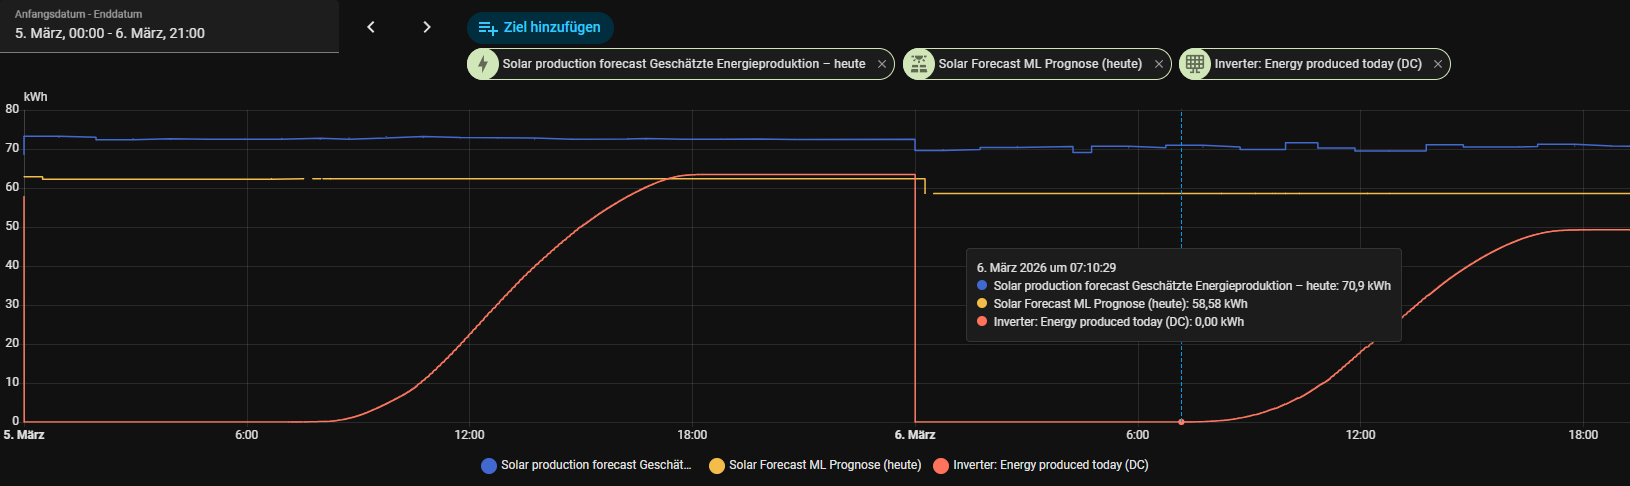
Gruß Ralf
Ganz locker… Tom  , ich weiß, dass alles, lese deine Beiträge ja aufmerksam und mit Genuss!
Es ist nur so, dass ich das bestmögliche Ergebnis brauche um meine Pläne in meinem Heim besser umsetzen zu können.
Dein SFML mit allen Nebenprogrammen ist genau das, was ich lange gesucht habe, und es wird immer genauer!
Es muss einfach noch eine Weile lernen, dann bin ich sicher, dass es zu 100% funktioniert.
Geduld ist hier das Maß und leichte Kritik macht dich nur noch besser 
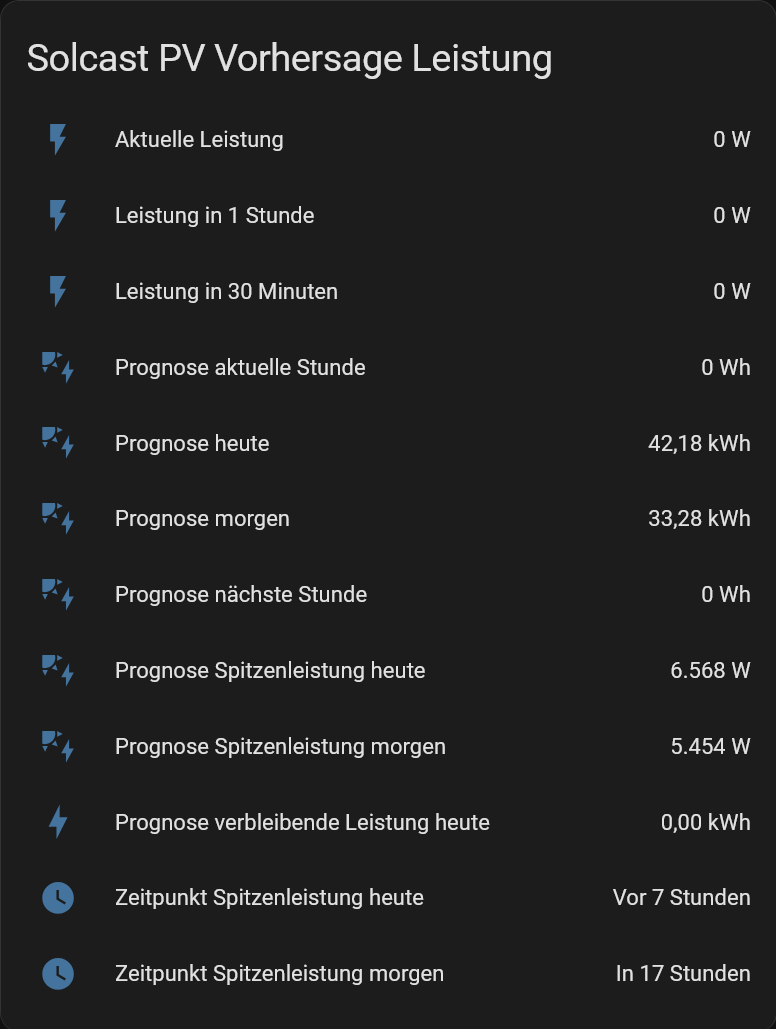
Heute hat SFML das beste Ergebnis (gestern übrings auch) 
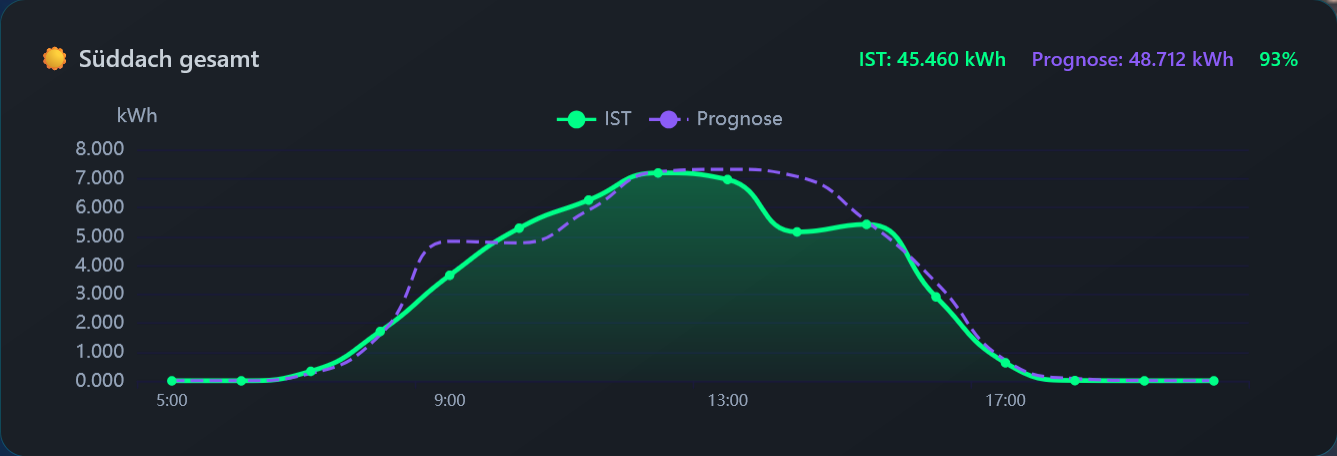

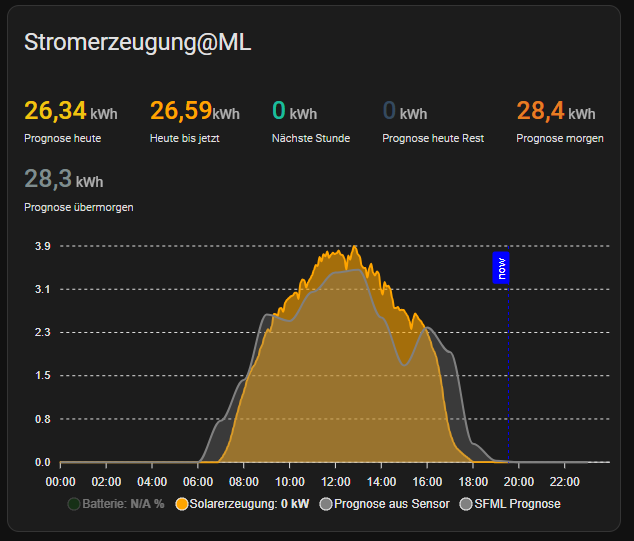
Darum geht’s mir ehrlich gesagt nicht, mir geht es um den Vergleich um abzuschätzen, im direkten Vergleich, welche Prognose besser trifft. Das geht aber leider nur dann, wenn man die gleichen Parameter ansetzt.
Das von Dir benannte Ziel / Einsatzzweck ist das Target das ich erreichen möchte.
Es war genau der Grund / Zweck warum ich damit überhaupt angefangen bin.
Ich kenne KEINE freie Solar-Prognose die einigermaßen trifft.
Solcast, Forecast Solar… you name it .. Sind für mich und per Definition KEINE Prognosen. Sie sind bestenfalls rollende Prognosen, da sie alle mehrfach nachregeln.
Aus diesem Grund bin ich aufmerksam auf Deinen Post geworden, da Du sagtest „ Solcast ist genauer“
Wenn das unter gleichen Parametern, also statische Prognose die sich im laufe des Tages nicht mehr verändert erstellt zum selben Zeitpunkt bewahrheitet… dann habe ich einen schweren Fehler den ich suchen muss.
Da du nun aber klargestellt hast, dass Dir das klar ist, das Solcast mehrfach nachgeregelt hat - es also nicht vergleichbar ist …. Bin ich beruhigt und muss nicht nach einem Fehler in meinem Code suchen
Danke!!
1 „Gefällt mir“
Nein musst du nicht, du machst das schon alles richtig.
Ich habe als Normalperson geschrieben, nicht als Entwickler, bin ich nämlich nicht, nur ein kleiner Anwender 
1 „Gefällt mir“
Danke!!
Es ist nunmal so, dass es wissenschafttlich anerkannte Abstufungen gibt, die ich mir als Ziel gesetzt habe.
Wechselnde Wetterbedingungen, Zeithorizont 24Std
0-12% → ausserordentlich// sehr sehr gut
13-25% → verlässlich/ sehr gut
26 - 30% → brauchbar / gut
31-40% → unzuverlässig / befriedigend
41 - … → unbrauchbar
Diese Standardisierten Werte versuche ich zu treffen! Wobei ich persönlich mit allem kleiner 20% mehr als zufrieden!!!
1 „Gefällt mir“
@Tom-HA , herzlichen Glückwunsch hier aus dem NordWesten! 
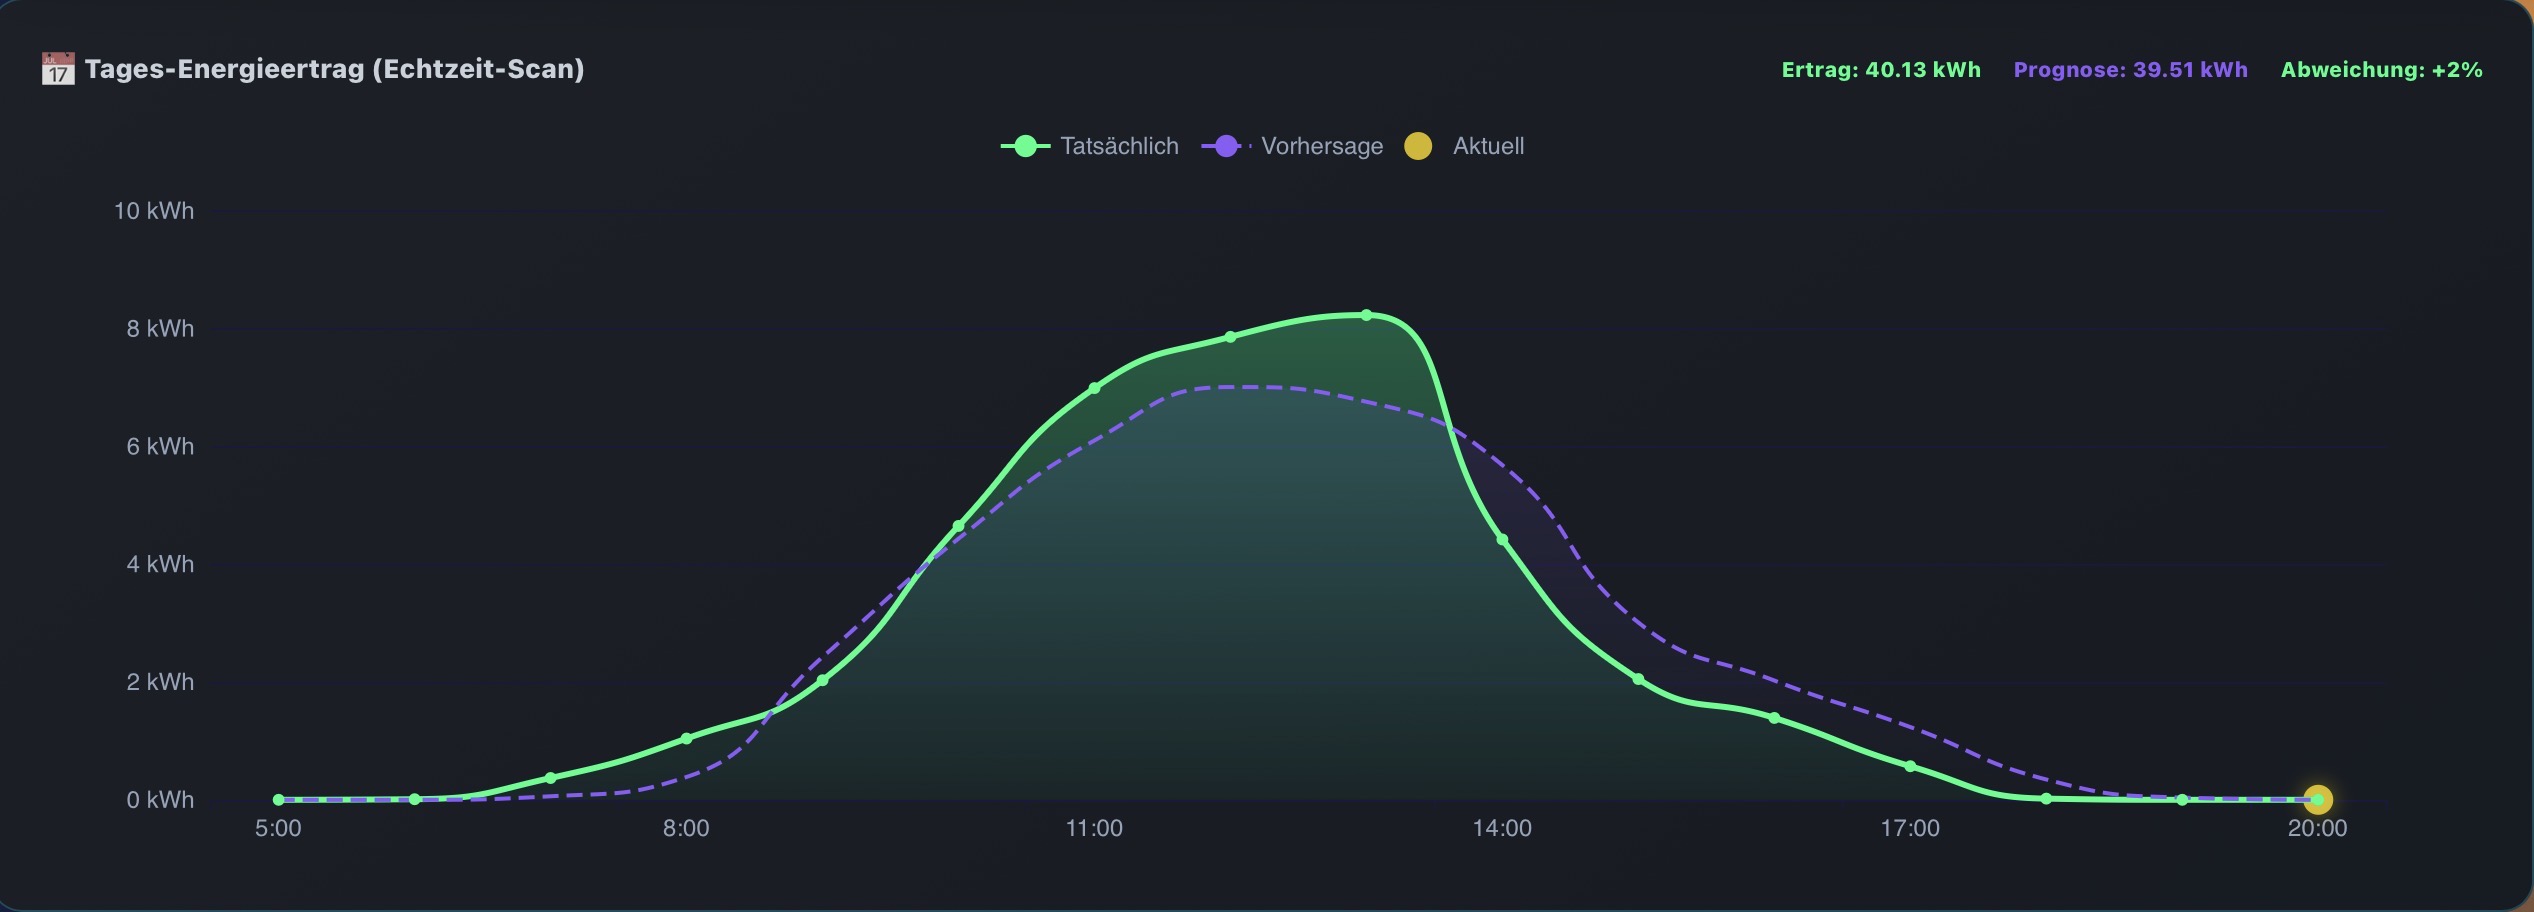
Die Mischgruppe wird auch bald gelernt sein!
1 „Gefällt mir“
2 „Gefällt mir“

1 „Gefällt mir“
type: sections
max_columns: 4
title: Test
path: test
subview: false
icon: mdi:test-tube
sections:
- type: grid
cards:
- type: horizontal-stack
cards:
- type: custom:button-card
icon: mdi:chevron-left
name: Zurück
styles:
card:
- background: "linear-gradient(180deg, #FFFFFF, #A7D8F1);"
- border-radius: 14px
- padding: 12px
- box-shadow: 0 4px 10px rgba(0,0,0,0.2)
- height: 70px
- width: 140px
tap_action:
action: call-service
service: input_number.increment
service_data:
entity_id: input_number.sfml_day_offset
- type: custom:button-card
entity: sensor.sfml_display_date
show_icon: false
show_name: true
name: "[[[ return states['sensor.sfml_display_date'].state; ]]]"
styles:
card:
- background: "linear-gradient(180deg, #FFFFFF, #A7D8F1);"
- border-radius: 14px
- padding: 12px
- box-shadow: 0 4px 10px rgba(0,0,0,0.2)
- height: 70px
- width: 140px
name:
- font-size: 16px
- font-weight: bold
tap_action:
action: call-service
service: input_number.set_value
service_data:
entity_id: input_number.sfml_day_offset
value: 0
- type: custom:button-card
icon: mdi:chevron-right
name: Vorwärts
styles:
card:
- background: "linear-gradient(180deg, #FFFFFF, #A7D8F1);"
- border-radius: 14px
- padding: 12px
- box-shadow: 0 4px 10px rgba(0,0,0,0.2)
- height: 70px
- width: 140px
tap_action:
action: call-service
service: input_number.decrement
service_data:
entity_id: input_number.sfml_day_offset
- type: vertical-stack
cards:
- type: vertical-stack
cards:
- type: conditional
conditions:
- condition: numeric_state
entity: input_number.sfml_day_offset
below: 1
card:
type: custom:config-template-card
entities:
- sensor.sfml_stats_gesamt
- sensor.pv_ertrag_pro_tag_insgesamt
- input_number.sfml_day_offset
card:
type: custom:apexcharts-card
header:
title: PV-Prognose und Ertrag
show: true
standard_format: true
show_states: true
colorize_states: true
apex_config:
chart:
type: line
height: 1
sparkline:
enabled: true
yaxis:
- show: false
xaxis:
show: false
legend:
show: false
series:
- entity: sensor.pv_ertrag_pro_tag_insgesamt
name: Ertrag
color: orange
float_precision: 1
unit: " kWh"
show:
legend_value: true
in_header: true
in_chart: false
data_generator: |
return [[new Date(), parseFloat(entity.state)]];
- entity: sensor.sfml_stats_gesamt
name: Prognose heute
color: grey
float_precision: 1
unit: " kWh"
show:
legend_value: true
in_header: true
in_chart: false
data_generator: >
return [[new Date(),
parseFloat(entity.attributes.prediction_total)]];
- entity: sensor.sfml_stats_gesamt
name: Genauigkeit
color: green
float_precision: 0
unit: " %"
show:
legend_value: true
in_header: true
in_chart: false
data_generator: >
return [[new Date(),
parseFloat(entity.attributes.accuracy)]];
card_mod:
style: |
ha-card {
background: transparent !important;
box-shadow: none !important;
border: none !important;
padding: 2px 8px;
font-size: 14px;
border-radius: 12px;
}
- type: conditional
conditions:
- condition: numeric_state
entity: input_number.sfml_day_offset
above: 0
card:
type: custom:config-template-card
entities:
- sensor.sfml_stats_gesamt_history
- input_number.sfml_day_offset
card:
type: custom:apexcharts-card
header:
title: PV-Prognose und Ertrag
show: true
standard_format: true
show_states: true
colorize_states: true
apex_config:
chart:
type: line
height: 1
sparkline:
enabled: true
yaxis:
- show: false
xaxis:
show: false
legend:
show: false
series:
- entity: sensor.sfml_stats_gesamt_history
name: Ertrag
color: orange
yaxis_id: header_only
show:
legend_value: true
in_header: true
in_chart: false
data_generator: >
const offset =
parseInt(hass.states['input_number.sfml_day_offset'].state
|| '0'); const sel = new Date();
sel.setDate(sel.getDate() - offset); const pad = n =>
String(n).padStart(2,'0'); const dk =
sel.getFullYear() + '-' + pad(sel.getMonth()+1) + '-'
+ pad(sel.getDate()); const hist =
entity.attributes.history_data ?
JSON.parse(entity.attributes.history_data) : {}; let
day = hist[dk]; if (!day) return [[new Date(),0]]; day
= typeof day === 'string' ? JSON.parse(day) : day;
const total_actual = day.reduce((sum,e)=> sum +
(e.actual!==null?e.actual:0),0); return [[new Date(),
Math.round(total_actual*10)/10]];
- entity: sensor.sfml_stats_gesamt_history
name: Prognose
color: grey
yaxis_id: header_only
show:
legend_value: true
in_header: true
in_chart: false
data_generator: >
const offset =
parseInt(hass.states['input_number.sfml_day_offset'].state
|| '0'); const sel = new Date();
sel.setDate(sel.getDate() - offset); const pad = n =>
String(n).padStart(2,'0'); const dk =
sel.getFullYear() + '-' + pad(sel.getMonth()+1) + '-'
+ pad(sel.getDate()); const hist =
entity.attributes.history_data ?
JSON.parse(entity.attributes.history_data) : {}; let
day = hist[dk]; if (!day) return [[new Date(),0]]; day
= typeof day === 'string' ? JSON.parse(day) : day;
const total_pred = day.reduce((sum,e)=> sum +
(e.pred!==null?e.pred:0),0); return [[new Date(),
Math.round(total_pred*10)/10]];
- entity: sensor.sfml_stats_gesamt_history
name: Genauigkeit
color: green
unit: " %"
yaxis_id: header_only
show:
legend_value: true
in_header: true
in_chart: false
data_generator: >
const offset =
parseInt(hass.states['input_number.sfml_day_offset'].state
|| '0'); const sel = new Date();
sel.setDate(sel.getDate() - offset); const pad = n =>
String(n).padStart(2,'0'); const dk =
sel.getFullYear() + '-' + pad(sel.getMonth()+1) + '-'
+ pad(sel.getDate()); const hist =
entity.attributes.history_data ?
JSON.parse(entity.attributes.history_data) : {}; let
day = hist[dk]; if (!day) return [[new Date(),0]]; day
= typeof day === 'string' ? JSON.parse(day) : day;
const total_actual = day.reduce((sum,e)=> sum +
(e.actual!==null?e.actual:0),0); const total_pred =
day.reduce((sum,e)=> sum +
(e.pred!==null?e.pred:0),0); const accuracy =
total_actual ? Math.max(0, Math.min(100, Math.round((1
- Math.abs(total_actual -
total_pred)/total_actual)*100))) : 0; return [[new
Date(), accuracy]];
card_mod:
style: |
ha-card {
background: transparent !important;
box-shadow: none !important;
border: none !important;
padding: 2px 8px;
font-size: 14px;
border-radius: 12px;
}
grid_options:
columns: 48
rows: auto
- type: vertical-stack
cards:
- type: conditional
conditions:
- condition: numeric_state
entity: input_number.sfml_day_offset
below: 1
card:
type: custom:config-template-card
entities:
- sensor.sun_next_rising
- sensor.sun_next_setting
- sensor.none_beste_stunde
card:
type: custom:apexcharts-card
header:
title: " "
show: false
standard_format: true
show_states: true
colorize_states: true
graph_span: |-
${(() => {
const rise = new Date(states['sensor.sun_next_rising'].state);
const set = new Date(states['sensor.sun_next_setting'].state);
const now = new Date();
if (rise.getDate() !== now.getDate()) rise.setDate(rise.getDate() - 1);
if (set.getDate() !== now.getDate()) set.setDate(set.getDate() - 1);
// +2h vorne und +2h hinten = +240 Minuten
const diffMinutes = Math.round((set - rise) / 60000) + 240;
return diffMinutes + "m";
})()}
span:
start: day
offset: |-
${(() => {
const rise = new Date(states['sensor.sun_next_rising'].state);
const now = new Date();
if (rise.getDate() !== now.getDate()) rise.setDate(rise.getDate() - 1);
// 2h früher starten
const minutes = (rise.getHours() * 60 + rise.getMinutes()) - 120;
return "+" + minutes + "m";
})()}
now:
show: true
color: gold
apex_config:
markers:
size:
- 0
- 0
- 0
- 8
fill:
type: gradient
gradient:
shade: light
type: vertical
shadeIntensity: 0.2
opacityFrom: 1
opacityTo: 0.1
stops:
- 0
- 100
chart:
background: transparent
height: 250
zoom:
enabled: true
type: x
autoScaleYaxis: true
toolbar:
show: true
tools:
zoom: true
zoomin: true
zoomout: true
pan: true
reset: true
download: false
tooltip:
enabled: true
shared: false
intersect: false
followCursor: true
x:
show: true
fixed:
enabled: false
legend:
show: true
xaxis:
type: datetime
labels:
datetimeUTC: false
format: HH:mm
annotations:
xaxis:
- x: |-
${(() => {
const r = new Date(states['sensor.sun_next_rising'].state);
const n = new Date();
if (r.getDate() !== n.getDate()) r.setDate(r.getDate() - 1);
return r.getTime();
})()}
borderColor: gold
label:
text: ☀️ Aufgang
style:
color: black
background: gold
- x: |-
${(() => {
const s = new Date(states['sensor.sun_next_setting'].state);
const n = new Date();
if (s.getDate() !== n.getDate()) s.setDate(s.getDate() - 1);
return s.getTime();
})()}
borderColor: orange
label:
text: 🌙 Untergang
style:
color: black
background: orange
- x: |-
${(() => {
const best = states['sensor.none_beste_stunde'].state;
if (!best || best === 'unknown') return null;
const [hour, minute] = best.split(':').map(Number);
const d = new Date();
d.setHours(hour, minute || 0, 0, 0);
return d.getTime();
})()}
x2: |-
${(() => {
const best = states['sensor.none_beste_stunde'].state;
if (!best || best === 'unknown') return null;
const [hour, minute] = best.split(':').map(Number);
const d = new Date();
d.setHours(hour + 1, minute || 0, 0, 0);
return d.getTime();
})()}
fillColor: rgba(0, 255, 0, 0.2)
opacity: 1
label:
text: ⭐ Beste Stunde
style:
background: rgba(0, 255, 0, 0.4)
color: black
all_series_config:
type: area
opacity: 0.9
stroke_width: 2
yaxis:
- id: kW
show: true
min: 0
apex_config:
tickAmount: 5
title:
text: kWh
- id: accuracy_axis
show: false
min: 0
max: 100
- id: sun
opposite: true
apex_config:
title:
text: Sonnenstand
show: true
min: 0
max: 90
series:
- entity: sensor.gesamt_pv_leistung
name: Tatsächlich
float_precision: 3
color: orange
stroke_width: 2
opacity: 0.6
yaxis_id: kW
unit: kW
transform: return x/1000;
extend_to: now
show:
legend_value: false
in_header: false
group_by:
func: avg
duration: 5m
- entity: sensor.sfml_stats_gesamt
name: Prognose
color: grey
opacity: 0.3
stroke_width: 2
yaxis_id: kW
unit: " kWh"
extend_to: false
show:
legend_value: false
in_header: false
data_generator: |
var today = new Date();
var data = JSON.parse(entity.attributes.hourly_data);
return data.map((entry) => {
var date = new Date(
today.getFullYear(),
today.getMonth(),
today.getDate(),
entry.hour,
30
);
return [date, entry.pred];
});
- entity: sensor.pv_ertrag_pro_tag_insgesamt
name: Ertrag
yaxis_id: accuracy_axis
color: orange
float_precision: 1
unit: " kWh"
show:
legend_value: true
in_header: true
in_chart: false
data_generator: |
return [[new Date(), parseFloat(entity.state)]];
- entity: sensor.sfml_stats_gesamt
name: Prognose heute
yaxis_id: accuracy_axis
color: grey
float_precision: 1
unit: " kWh"
show:
legend_value: true
in_header: true
in_chart: false
data_generator: >
return [[new Date(),
entity.attributes.prediction_total]];
- entity: sensor.sun_solar_elevation
name: Sonnenhöhe
type: line
color: gold
stroke_width: 2
yaxis_id: sun
extend_to: false
show:
legend_value: false
in_header: false
in_legend: true
group_by:
func: avg
duration: 10m
- entity: sensor.sun_solar_elevation
name: Sonnenpunkt
type: line
yaxis_id: sun
extend_to: false
color: gold
stroke_width: 0
show:
legend_value: false
in_header: false
in_legend: false
data_generator: |
return [[Date.now(), Number(entity.state)]];
card_mod:
style: |
ha-card {
background: transparent !important;
box-shadow: none !important;
border: none !important;
padding: 1px;
margin-top: -30px;
font-size: 11px;
border-radius: 12px;
margin-top: -10px;
}
- type: conditional
conditions:
- condition: numeric_state
entity: input_number.sfml_day_offset
above: 0
card:
type: custom:config-template-card
entities:
- sensor.sun_next_rising
- sensor.sun_next_setting
- input_number.sfml_day_offset
card:
type: custom:apexcharts-card
grid_options:
columns: full
header:
title: " "
show: false
standard_format: true
show_states: true
colorize_states: true
graph_span: |-
${(() => {
const rise = new Date(states['sensor.sun_next_rising'].state);
const set = new Date(states['sensor.sun_next_setting'].state);
const now = new Date();
if (rise.getDate() !== now.getDate()) rise.setDate(rise.getDate() - 1);
if (set.getDate() !== now.getDate()) set.setDate(set.getDate() - 1);
// Aufgang -2h bis Untergang +2h
const diffMinutes = Math.round((set - rise) / 60000) + 240;
return diffMinutes + "m";
})()}
span:
start: day
offset: |-
${(() => {
const rise = new Date(states['sensor.sun_next_rising'].state);
const now = new Date();
if (rise.getDate() !== now.getDate()) rise.setDate(rise.getDate() - 1);
// Start = Aufgang -2h
const minutes = (rise.getHours() * 60 + rise.getMinutes()) - 120;
return "+" + minutes + "m";
})()}
apex_config:
chart:
background: transparent
height: 250
zoom:
enabled: true
type: x
autoScaleYaxis: true
toolbar:
show: true
tools:
zoom: true
zoomin: true
zoomout: true
pan: true
reset: true
download: false
fill:
type: gradient
gradient:
shade: light
type: vertical
shadeIntensity: 0.2
opacityFrom: 1
opacityTo: 0.1
stops:
- 0
- 100
xaxis:
type: datetime
labels:
datetimeUTC: false
format: HH:mm
annotations:
xaxis:
- x: |-
${(() => {
const r = new Date(states['sensor.sun_next_rising'].state);
const n = new Date();
if (r.getDate() !== n.getDate()) r.setDate(r.getDate() - 1);
return r.getTime();
})()}
borderColor: gold
label:
text: ☀️ Aufgang
style:
color: black
background: gold
- x: |-
${(() => {
const s = new Date(states['sensor.sun_next_setting'].state);
const n = new Date();
if (s.getDate() !== n.getDate()) s.setDate(s.getDate() - 1);
return s.getTime();
})()}
borderColor: orange
label:
text: 🌙 Untergang
style:
color: black
background: orange
legend:
show: true
all_series_config:
type: area
opacity: 0.9
stroke_width: 2
yaxis:
- id: kW
show: true
min: 0
apex_config:
tickAmount: 5
title:
text: kWh (DC)
- id: header_only
show: false
series:
- entity: sensor.sfml_stats_gesamt_history
name: Tatsächlich
color: orange
stroke_width: 2
opacity: 0.6
yaxis_id: kW
unit: kW
extend_to: false
show:
legend_value: false
in_header: false
data_generator: >
var offset =
parseInt(hass.states['input_number.sfml_day_offset']?.state
|| '0'); var sel = new Date();
sel.setDate(sel.getDate() - offset); var pad = n =>
String(n).padStart(2,'0'); var dk = sel.getFullYear()
+ '-' + pad(sel.getMonth()+1) + '-' +
pad(sel.getDate()); var now = new Date(); var y =
now.getFullYear(), m = now.getMonth(), d =
now.getDate(); var hist = typeof
entity.attributes.history_data === 'string'
? JSON.parse(entity.attributes.history_data)
: entity.attributes.history_data;
var day = hist ? hist[dk] : null; if (!day) return
[[new Date(y,m,d,0,0),0],[new Date(y,m,d,23,59),0]];
day = typeof day === 'string' ? JSON.parse(day) : day;
var pts = [[new Date(y,m,d,0,0),0]];
day.forEach(function(e){
if (e.actual !== null && e.actual !== undefined)
pts.push([new Date(y,m,d,e.hour,30), e.actual]);
}); pts.push([new Date(y,m,d,23,59),0]); return pts;
- entity: sensor.sfml_stats_gesamt_history
name: Prognose
color: grey
opacity: 0.3
stroke_width: 2
yaxis_id: kW
unit: " kWh"
extend_to: false
show:
legend_value: false
in_header: false
data_generator: >
var offset =
parseInt(hass.states['input_number.sfml_day_offset']?.state
|| '0'); var sel = new Date();
sel.setDate(sel.getDate() - offset); var pad = n =>
String(n).padStart(2,'0'); var dk = sel.getFullYear()
+ '-' + pad(sel.getMonth()+1) + '-' +
pad(sel.getDate()); var now = new Date(); var y =
now.getFullYear(), m = now.getMonth(), d =
now.getDate(); var hist = typeof
entity.attributes.history_data === 'string'
? JSON.parse(entity.attributes.history_data)
: entity.attributes.history_data;
var day = hist ? hist[dk] : null; if (!day) return
[[new Date(y,m,d,0,0),0],[new Date(y,m,d,23,59),0]];
day = typeof day === 'string' ? JSON.parse(day) : day;
var pts = [[new Date(y,m,d,0,0),0]];
day.forEach(function(e){
pts.push([new Date(y,m,d,e.hour,30), e.pred]);
}); pts.push([new Date(y,m,d,23,59),0]); return pts;
- entity: sensor.sfml_stats_gesamt_history
yaxis_id: header_only
name: Ertrag
color: orange
float_precision: 1
unit: " kWh"
show:
legend_value: true
in_header: true
in_chart: false
data_generator: >
var offset =
parseInt(hass.states['input_number.sfml_day_offset']?.state
|| '0'); var sel = new Date();
sel.setDate(sel.getDate() - offset); var pad = n =>
String(n).padStart(2,'0'); var dk = sel.getFullYear()
+ '-' + pad(sel.getMonth()+1) + '-' +
pad(sel.getDate()); var hist = typeof
entity.attributes.history_data === 'string'
? JSON.parse(entity.attributes.history_data)
: entity.attributes.history_data;
var day = hist ? hist[dk] : null; if (!day) return
[[new Date(), 0]]; day = typeof day === 'string' ?
JSON.parse(day) : day; var total =
day.reduce(function(s,e){ return s + (e.actual || 0);
},0); return [[new Date(), Math.round(total * 10) /
10]];
- entity: sensor.sfml_stats_gesamt_history
yaxis_id: header_only
name: Prognose
color: grey
float_precision: 1
unit: " kWh"
show:
legend_value: true
in_header: true
in_chart: false
data_generator: >
var offset =
parseInt(hass.states['input_number.sfml_day_offset']?.state
|| '0'); var sel = new Date();
sel.setDate(sel.getDate() - offset); var pad = n =>
String(n).padStart(2,'0'); var dk = sel.getFullYear()
+ '-' + pad(sel.getMonth()+1) + '-' +
pad(sel.getDate()); var hist = typeof
entity.attributes.history_data === 'string'
? JSON.parse(entity.attributes.history_data)
: entity.attributes.history_data;
var day = hist ? hist[dk] : null; if (!day) return
[[new Date(), 0]]; day = typeof day === 'string' ?
JSON.parse(day) : day; var total =
day.reduce(function(s,e){ return s + (e.pred || 0);
},0); return [[new Date(), Math.round(total * 10) /
10]];
- entity: input_number.sfml_day_offset
yaxis_id: header_only
name: _trigger
show:
in_chart: false
in_header: false
legend_value: false
data_generator: |
return [];
card_mod:
style: |
ha-card {
background: transparent !important;
box-shadow: none !important;
border: none !important;
padding: 1px;
margin-top: -30px;
font-size: 11px;
border-radius: 12px;
margin-top: -10px;
}
grid_options:
columns: 48
rows: auto
- type: custom:config-template-card
entities:
- sensor.sun_next_rising
- sensor.sun_next_setting
card:
type: custom:apexcharts-card
header:
title: Nordseite
show: true
standard_format: true
show_states: true
colorize_states: true
graph_span: |-
${(() => {
const rise = new Date(states['sensor.sun_next_rising'].state);
const set = new Date(states['sensor.sun_next_setting'].state);
const now = new Date();
if (rise.getDate() !== now.getDate()) rise.setDate(rise.getDate() - 1);
if (set.getDate() !== now.getDate()) set.setDate(set.getDate() - 1);
const diffMinutes = Math.round((set - rise) / 60000) + 240;
return diffMinutes + "m";
})()}
span:
start: day
offset: |-
${(() => {
const rise = new Date(states['sensor.sun_next_rising'].state);
const now = new Date();
if (rise.getDate() !== now.getDate()) rise.setDate(rise.getDate() - 1);
const minutes = (rise.getHours() * 60 + rise.getMinutes()) - 120;
return "+" + minutes + "m";
})()}
now:
show: true
color: gold
apex_config:
xaxis:
type: datetime
labels:
datetimeUTC: false
format: HH:mm
markers:
size:
- 0
- 0
- 0
- 8
fill:
type: gradient
gradient:
shade: light
type: vertical
shadeIntensity: 0.2
opacityFrom: 1
opacityTo: 0.1
stops:
- 0
- 100
chart:
height: 250px
zoom:
enabled: true
type: x
autoScaleYaxis: true
toolbar:
show: true
tools:
zoom: true
zoomin: true
zoomout: true
pan: true
reset: true
download: false
tooltip:
enabled: true
shared: false
intersect: false
followCursor: true
x:
show: true
fixed:
enabled: false
legend:
show: true
annotations:
xaxis:
- x: |-
${(() => {
const r = new Date(states['sensor.sun_next_rising'].state);
const n = new Date();
if (r.getDate() !== n.getDate()) r.setDate(r.getDate() - 1);
return r.getTime();
})()}
borderColor: gold
label:
text: ☀️ Aufgang
style:
color: black
background: gold
- x: |-
${(() => {
const s = new Date(states['sensor.sun_next_setting'].state);
const n = new Date();
if (s.getDate() !== n.getDate()) s.setDate(s.getDate() - 1);
return s.getTime();
})()}
borderColor: orange
label:
text: 🌙 Untergang
style:
color: black
background: orange
- x: ${Date.now()}
borderColor: gold
all_series_config:
type: area
opacity: 0.9
stroke_width: 2
yaxis:
- id: kW
show: true
min: 0
apex_config:
tickAmount: 5
title:
text: kWh
- id: accuracy_axis
show: false
min: 0
max: 100
- id: sun
opposite: true
show: true
min: 0
max: 90
apex_config:
title:
text: Sonnenstand
series:
- entity: sensor.growatt_sph_esp32_power_pv_1
name: Tatsächlich
float_precision: 3
color: orange
stroke_width: 2
opacity: 0.6
yaxis_id: kW
unit: kW
transform: return x/1000;
extend_to: now
show:
legend_value: false
in_header: false
group_by:
func: avg
duration: 5m
- entity: sensor.sfml_stats_pv_nordseite
name: Prognose
color: grey
opacity: 0.3
stroke_width: 2
yaxis_id: kW
unit: " kWh"
extend_to: false
show:
legend_value: false
in_header: false
data_generator: |
var today = new Date();
var data = JSON.parse(entity.attributes.hourly_data);
return data.map((entry) => {
var date = new Date(
today.getFullYear(),
today.getMonth(),
today.getDate(),
entry.hour,
30
);
return [date, entry.pred];
});
- entity: sensor.energie_pv_1_tag
name: Ertrag
yaxis_id: accuracy_axis
color: orange
float_precision: 1
unit: " kWh"
show:
legend_value: true
in_header: true
in_chart: false
data_generator: |
return [[new Date(), parseFloat(entity.state)]];
- entity: sensor.sfml_stats_pv_nordseite
name: Prognose heute
yaxis_id: accuracy_axis
color: grey
float_precision: 1
unit: " kWh"
show:
legend_value: true
in_header: true
in_chart: false
data_generator: |
return [[new Date(), entity.attributes.prediction_total]];
- entity: sensor.sfml_stats_pv_nordseite
name: Genauigkeit
yaxis_id: accuracy_axis
color: green
float_precision: 0
unit: " %"
show:
legend_value: true
in_header: true
in_chart: false
data_generator: |
return [[new Date(), entity.attributes.accuracy]];
- entity: sensor.sun_solar_elevation
name: Sonnenhöhe
type: line
color: gold
stroke_width: 2
yaxis_id: sun
extend_to: false
show:
legend_value: false
in_header: false
in_legend: true
group_by:
func: avg
duration: 10m
- entity: sensor.sun_solar_elevation
name: Sonnenpunkt
type: line
yaxis_id: sun
extend_to: false
color: gold
stroke_width: 0
show:
legend_value: false
in_header: false
in_legend: false
data_generator: |
return [[Date.now(), Number(entity.state)]];
card_mod:
style: |
ha-card {
background: transparent !important;
box-shadow: none !important;
border: none !important;
padding: 1px;
font-size: 11px;
border-radius: 12px;
margin-top: -10px;
}
grid_options:
columns: 16
rows: auto
- type: custom:config-template-card
entities:
- sensor.sun_next_rising
- sensor.sun_next_setting
card:
type: custom:apexcharts-card
header:
title: Südseite
show: true
standard_format: true
show_states: true
colorize_states: true
graph_span: |-
${(() => {
const rise = new Date(states['sensor.sun_next_rising'].state);
const set = new Date(states['sensor.sun_next_setting'].state);
const now = new Date();
if (rise.getDate() !== now.getDate()) rise.setDate(rise.getDate() - 1);
if (set.getDate() !== now.getDate()) set.setDate(set.getDate() - 1);
const diffMinutes = Math.round((set - rise) / 60000) + 240;
return diffMinutes + "m";
})()}
span:
start: day
offset: |-
${(() => {
const rise = new Date(states['sensor.sun_next_rising'].state);
const now = new Date();
if (rise.getDate() !== now.getDate()) rise.setDate(rise.getDate() - 1);
const minutes = (rise.getHours() * 60 + rise.getMinutes()) - 120;
return "+" + minutes + "m";
})()}
now:
show: true
color: gold
apex_config:
xaxis:
type: datetime
labels:
datetimeUTC: false
format: HH:mm
markers:
size:
- 0
- 0
- 0
- 8
fill:
type: gradient
gradient:
shade: light
type: vertical
shadeIntensity: 0.2
opacityFrom: 1
opacityTo: 0.1
stops:
- 0
- 100
chart:
height: 250px
zoom:
enabled: true
type: x
autoScaleYaxis: true
toolbar:
show: true
tools:
zoom: true
zoomin: true
zoomout: true
pan: true
reset: true
download: false
tooltip:
enabled: true
shared: false
intersect: false
followCursor: true
x:
show: true
fixed:
enabled: false
legend:
show: true
annotations:
xaxis:
- x: |-
${(() => {
const r = new Date(states['sensor.sun_next_rising'].state);
const n = new Date();
if (r.getDate() !== n.getDate()) r.setDate(r.getDate() - 1);
return r.getTime();
})()}
borderColor: gold
label:
text: ☀️ Aufgang
style:
color: black
background: gold
- x: |-
${(() => {
const s = new Date(states['sensor.sun_next_setting'].state);
const n = new Date();
if (s.getDate() !== n.getDate()) s.setDate(s.getDate() - 1);
return s.getTime();
})()}
borderColor: orange
label:
text: 🌙 Untergang
style:
color: black
background: orange
all_series_config:
type: area
opacity: 0.9
stroke_width: 2
yaxis:
- id: kW
show: true
min: 0
apex_config:
tickAmount: 5
title:
text: kWh
- id: accuracy_axis
show: false
min: 0
max: 100
- id: sun
opposite: true
show: true
min: 0
max: 90
apex_config:
title:
text: Sonnenstand
series:
- entity: sensor.growatt_sph_esp32_power_pv_2
name: Tatsächlich
float_precision: 3
color: orange
stroke_width: 2
opacity: 0.6
yaxis_id: kW
unit: kW
transform: return x/1000;
extend_to: now
show:
legend_value: false
in_header: false
group_by:
func: avg
duration: 5m
- entity: sensor.sfml_stats_pv_sudseite
name: Prognose
color: grey
opacity: 0.3
stroke_width: 2
yaxis_id: kW
unit: " kWh"
extend_to: false
show:
legend_value: false
in_header: false
data_generator: |
var today = new Date();
var data = JSON.parse(entity.attributes.hourly_data);
return data.map((entry) => {
var date = new Date(
today.getFullYear(),
today.getMonth(),
today.getDate(),
entry.hour,
30
);
return [date, entry.pred];
});
- entity: sensor.energie_pv_2_tag
name: Ertrag
yaxis_id: accuracy_axis
color: orange
float_precision: 1
unit: " kWh"
show:
legend_value: true
in_header: true
in_chart: false
data_generator: |
return [[new Date(), parseFloat(entity.state)]];
- entity: sensor.sfml_stats_pv_sudseite
name: Prognose heute
yaxis_id: accuracy_axis
color: grey
float_precision: 1
unit: " kWh"
show:
legend_value: true
in_header: true
in_chart: false
data_generator: |
return [[new Date(), entity.attributes.prediction_total]];
- entity: sensor.sfml_stats_pv_sudseite
name: Genauigkeit
yaxis_id: accuracy_axis
color: green
float_precision: 0
unit: " %"
show:
legend_value: true
in_header: true
in_chart: false
data_generator: |
return [[new Date(), entity.attributes.accuracy]];
- entity: sensor.sun_solar_elevation
name: Sonnenhöhe
type: line
color: gold
stroke_width: 2
yaxis_id: sun
extend_to: false
show:
legend_value: false
in_header: false
in_legend: true
group_by:
func: avg
duration: 10m
- entity: sensor.sun_solar_elevation
name: Sonnenpunkt
type: line
yaxis_id: sun
extend_to: false
color: gold
stroke_width: 0
show:
legend_value: false
in_header: false
in_legend: false
data_generator: |
return [[Date.now(), Number(entity.state)]];
card_mod:
style: |
ha-card {
background: transparent !important;
box-shadow: none !important;
border: none !important;
padding: 1px;
font-size: 11px;
border-radius: 12px;
margin-top: -10px;
}
grid_options:
columns: 16
rows: auto
- type: custom:config-template-card
entities:
- sensor.sun_next_rising
- sensor.sun_next_setting
card:
type: custom:apexcharts-card
header:
title: Carport
show: true
standard_format: true
show_states: true
colorize_states: true
graph_span: |-
${(() => {
const rise = new Date(states['sensor.sun_next_rising'].state);
const set = new Date(states['sensor.sun_next_setting'].state);
const now = new Date();
if (rise.getDate() !== now.getDate()) rise.setDate(rise.getDate() - 1);
if (set.getDate() !== now.getDate()) set.setDate(set.getDate() - 1);
const diffMinutes = Math.round((set - rise) / 60000) + 240;
return diffMinutes + "m";
})()}
span:
start: day
offset: |-
${(() => {
const rise = new Date(states['sensor.sun_next_rising'].state);
const now = new Date();
if (rise.getDate() !== now.getDate()) rise.setDate(rise.getDate() - 1);
const minutes = (rise.getHours() * 60 + rise.getMinutes()) - 120;
return "+" + minutes + "m";
})()}
now:
show: true
color: gold
apex_config:
xaxis:
type: datetime
labels:
datetimeUTC: false
format: HH:mm
markers:
size:
- 0
- 0
- 0
- 8
fill:
type: gradient
gradient:
shade: light
type: vertical
shadeIntensity: 0.2
opacityFrom: 1
opacityTo: 0.1
stops:
- 0
- 100
chart:
height: 250px
zoom:
enabled: true
type: x
autoScaleYaxis: true
toolbar:
show: true
tools:
zoom: true
zoomin: true
zoomout: true
pan: true
reset: true
download: false
tooltip:
enabled: true
shared: false
intersect: false
followCursor: true
x:
show: true
fixed:
enabled: false
legend:
show: true
annotations:
xaxis:
- x: |-
${(() => {
const r = new Date(states['sensor.sun_next_rising'].state);
const n = new Date();
if (r.getDate() !== n.getDate()) r.setDate(r.getDate() - 1);
return r.getTime();
})()}
borderColor: gold
label:
text: ☀️ Aufgang
style:
color: black
background: gold
- x: |-
${(() => {
const s = new Date(states['sensor.sun_next_setting'].state);
const n = new Date();
if (s.getDate() !== n.getDate()) s.setDate(s.getDate() - 1);
return s.getTime();
})()}
borderColor: orange
label:
text: 🌙 Untergang
style:
color: black
background: orange
all_series_config:
type: area
opacity: 0.9
stroke_width: 2
yaxis:
- id: kW
show: true
min: 0
apex_config:
tickAmount: 5
title:
text: kWh
- id: accuracy_axis
show: false
min: 0
max: 100
- id: sun
opposite: true
show: true
min: 0
max: 90
apex_config:
title:
text: Sonnenstand
series:
- entity: sensor.pv_carport_switch_0_power
name: Tatsächlich
float_precision: 3
color: orange
stroke_width: 2
opacity: 0.6
yaxis_id: kW
unit: kW
transform: return x/1000;
extend_to: now
show:
legend_value: false
in_header: false
group_by:
func: avg
duration: 5m
- entity: sensor.sfml_stats_pv_carport
name: Prognose
color: grey
opacity: 0.3
stroke_width: 2
yaxis_id: kW
unit: " kWh"
extend_to: false
show:
legend_value: false
in_header: false
data_generator: |
var today = new Date();
var data = JSON.parse(entity.attributes.hourly_data);
return data.map((entry) => {
var date = new Date(
today.getFullYear(),
today.getMonth(),
today.getDate(),
entry.hour,
30
);
return [date, entry.pred];
});
- entity: sensor.daily_energy_pv_carport
name: Ertrag
yaxis_id: accuracy_axis
color: orange
float_precision: 1
unit: " kWh"
show:
legend_value: true
in_header: true
in_chart: false
data_generator: |
return [[new Date(), parseFloat(entity.state)]];
- entity: sensor.sfml_stats_pv_carport
name: Prognose heute
yaxis_id: accuracy_axis
color: grey
float_precision: 1
unit: " kWh"
show:
legend_value: true
in_header: true
in_chart: false
data_generator: |
return [[new Date(), entity.attributes.prediction_total]];
- entity: sensor.sfml_stats_pv_carport
name: Genauigkeit
yaxis_id: accuracy_axis
color: green
float_precision: 0
unit: " %"
show:
legend_value: true
in_header: true
in_chart: false
data_generator: |
return [[new Date(), entity.attributes.accuracy]];
- entity: sensor.sun_solar_elevation
name: Sonnenhöhe
type: line
color: gold
stroke_width: 2
yaxis_id: sun
extend_to: false
show:
legend_value: false
in_header: false
in_legend: true
group_by:
func: avg
duration: 10m
- entity: sensor.sun_solar_elevation
name: Sonnenpunkt
type: line
yaxis_id: sun
extend_to: false
color: gold
stroke_width: 0
show:
legend_value: false
in_header: false
in_legend: false
data_generator: |
return [[Date.now(), Number(entity.state)]];
card_mod:
style: |
ha-card {
background: transparent !important;
box-shadow: none !important;
border: none !important;
padding: 1px;
font-size: 11px;
border-radius: 12px;
margin-top: -10px;
}
grid_options:
columns: 16
rows: auto
- type: custom:config-template-card
entities:
- sensor.sun_next_rising
- sensor.sun_next_setting
card:
type: custom:apexcharts-card
header:
title: Gartenhütte
show: true
standard_format: true
show_states: true
colorize_states: true
graph_span: |-
${(() => {
const rise = new Date(states['sensor.sun_next_rising'].state);
const set = new Date(states['sensor.sun_next_setting'].state);
const now = new Date();
if (rise.getDate() !== now.getDate()) rise.setDate(rise.getDate() - 1);
if (set.getDate() !== now.getDate()) set.setDate(set.getDate() - 1);
const diffMinutes = Math.round((set - rise) / 60000) + 240;
return diffMinutes + "m";
})()}
span:
start: day
offset: |-
${(() => {
const rise = new Date(states['sensor.sun_next_rising'].state);
const now = new Date();
if (rise.getDate() !== now.getDate()) rise.setDate(rise.getDate() - 1);
const minutes = (rise.getHours() * 60 + rise.getMinutes()) - 120;
return "+" + minutes + "m";
})()}
now:
show: true
color: gold
apex_config:
xaxis:
type: datetime
labels:
datetimeUTC: false
format: HH:mm
markers:
size:
- 0
- 0
- 0
- 8
fill:
type: gradient
gradient:
shade: light
type: vertical
shadeIntensity: 0.2
opacityFrom: 1
opacityTo: 0.1
stops:
- 0
- 100
chart:
height: 250px
zoom:
enabled: true
type: x
autoScaleYaxis: true
toolbar:
show: true
tools:
zoom: true
zoomin: true
zoomout: true
pan: true
reset: true
download: false
tooltip:
enabled: true
shared: false
intersect: false
followCursor: true
x:
show: true
fixed:
enabled: false
legend:
show: true
annotations:
xaxis:
- x: |-
${(() => {
const r = new Date(states['sensor.sun_next_rising'].state);
const n = new Date();
if (r.getDate() !== n.getDate()) r.setDate(r.getDate() - 1);
return r.getTime();
})()}
borderColor: gold
label:
text: ☀️ Aufgang
style:
color: black
background: gold
- x: |-
${(() => {
const s = new Date(states['sensor.sun_next_setting'].state);
const n = new Date();
if (s.getDate() !== n.getDate()) s.setDate(s.getDate() - 1);
return s.getTime();
})()}
borderColor: orange
label:
text: 🌙 Untergang
style:
color: black
background: orange
all_series_config:
type: area
opacity: 0.9
stroke_width: 2
yaxis:
- id: kW
show: true
min: 0
apex_config:
tickAmount: 5
title:
text: kWh
- id: accuracy_axis
show: false
min: 0
max: 100
- id: sun
opposite: true
show: true
min: 0
max: 90
apex_config:
title:
text: Sonnenstand
series:
- entity: sensor.pv_gartenhuette_switch_0_power
name: Tatsächlich
float_precision: 3
color: orange
stroke_width: 2
opacity: 0.6
yaxis_id: kW
unit: kW
transform: return x/1000;
extend_to: now
show:
legend_value: false
in_header: false
group_by:
func: avg
duration: 5m
- entity: sensor.sfml_stats_pv_gartenhutte
name: Prognose
color: grey
opacity: 0.3
stroke_width: 2
yaxis_id: kW
unit: " kWh"
extend_to: false
show:
legend_value: false
in_header: false
data_generator: |
var today = new Date();
var data = JSON.parse(entity.attributes.hourly_data);
return data.map((entry) => {
var date = new Date(
today.getFullYear(),
today.getMonth(),
today.getDate(),
entry.hour,
30
);
return [date, entry.pred];
});
- entity: sensor.daily_energy_pv_gartenhuette
name: Ertrag
yaxis_id: accuracy_axis
color: orange
float_precision: 1
unit: " kWh"
show:
legend_value: true
in_header: true
in_chart: false
data_generator: |
return [[new Date(), parseFloat(entity.state)]];
- entity: sensor.sfml_stats_pv_gartenhutte
name: Prognose heute
yaxis_id: accuracy_axis
color: grey
float_precision: 1
unit: " kWh"
show:
legend_value: true
in_header: true
in_chart: false
data_generator: |
return [[new Date(), entity.attributes.prediction_total]];
- entity: sensor.sfml_stats_pv_gartenhutte
name: Genauigkeit
yaxis_id: accuracy_axis
color: green
float_precision: 0
unit: " %"
show:
legend_value: true
in_header: true
in_chart: false
data_generator: |
return [[new Date(), entity.attributes.accuracy]];
- entity: sensor.sun_solar_elevation
name: Sonnenhöhe
type: line
color: gold
stroke_width: 2
yaxis_id: sun
extend_to: false
show:
legend_value: false
in_header: false
in_legend: true
group_by:
func: avg
duration: 10m
- entity: sensor.sun_solar_elevation
name: Sonnenpunkt
type: line
yaxis_id: sun
extend_to: false
color: gold
stroke_width: 0
show:
legend_value: false
in_header: false
in_legend: false
data_generator: |
return [[Date.now(), Number(entity.state)]];
card_mod:
style: |
ha-card {
background: transparent !important;
box-shadow: none !important;
border: none !important;
padding: 1px;
font-size: 11px;
border-radius: 12px;
margin-top: -10px;
}
grid_options:
columns: 16
rows: auto
- type: custom:config-template-card
entities:
- sensor.sun_next_rising
- sensor.sun_next_setting
card:
type: custom:apexcharts-card
header:
title: Pool
show: true
standard_format: true
show_states: true
colorize_states: true
graph_span: |-
${(() => {
const rise = new Date(states['sensor.sun_next_rising'].state);
const set = new Date(states['sensor.sun_next_setting'].state);
const now = new Date();
if (rise.getDate() !== now.getDate()) rise.setDate(rise.getDate() - 1);
if (set.getDate() !== now.getDate()) set.setDate(set.getDate() - 1);
const diffMinutes = Math.round((set - rise) / 60000) + 240;
return diffMinutes + "m";
})()}
span:
start: day
offset: |-
${(() => {
const rise = new Date(states['sensor.sun_next_rising'].state);
const now = new Date();
if (rise.getDate() !== now.getDate()) rise.setDate(rise.getDate() - 1);
const minutes = (rise.getHours() * 60 + rise.getMinutes()) - 120;
return "+" + minutes + "m";
})()}
now:
show: true
color: gold
apex_config:
xaxis:
type: datetime
labels:
datetimeUTC: false
format: HH:mm
markers:
size:
- 0
- 0
- 0
- 8
fill:
type: gradient
gradient:
shade: light
type: vertical
shadeIntensity: 0.2
opacityFrom: 1
opacityTo: 0.1
stops:
- 0
- 100
chart:
height: 250px
zoom:
enabled: true
type: x
autoScaleYaxis: true
toolbar:
show: true
tools:
zoom: true
zoomin: true
zoomout: true
pan: true
reset: true
download: false
tooltip:
enabled: true
shared: false
intersect: false
followCursor: true
x:
show: true
fixed:
enabled: false
legend:
show: true
annotations:
xaxis:
- x: |-
${(() => {
const r = new Date(states['sensor.sun_next_rising'].state);
const n = new Date();
if (r.getDate() !== n.getDate()) r.setDate(r.getDate() - 1);
return r.getTime();
})()}
borderColor: gold
label:
text: ☀️ Aufgang
style:
color: black
background: gold
- x: |-
${(() => {
const s = new Date(states['sensor.sun_next_setting'].state);
const n = new Date();
if (s.getDate() !== n.getDate()) s.setDate(s.getDate() - 1);
return s.getTime();
})()}
borderColor: orange
label:
text: 🌙 Untergang
style:
color: black
background: orange
all_series_config:
type: area
opacity: 0.9
stroke_width: 2
yaxis:
- id: kW
show: true
min: 0
apex_config:
tickAmount: 5
title:
text: kWh
- id: accuracy_axis
show: false
min: 0
max: 100
- id: sun
opposite: true
show: true
min: 0
max: 90
apex_config:
title:
text: Sonnenstand
series:
- entity: sensor.shelly_pv_pool_switch_0_power_numeric
name: Tatsächlich
float_precision: 3
color: orange
stroke_width: 2
opacity: 0.6
yaxis_id: kW
unit: kW
transform: return x/1000;
extend_to: now
show:
legend_value: false
in_header: false
group_by:
func: avg
duration: 5m
- entity: sensor.sfml_stats_pv_pool
name: Prognose
color: grey
opacity: 0.3
stroke_width: 2
yaxis_id: kW
unit: " kWh"
extend_to: false
show:
legend_value: false
in_header: false
data_generator: |
var today = new Date();
var data = JSON.parse(entity.attributes.hourly_data);
return data.map((entry) => {
var date = new Date(
today.getFullYear(),
today.getMonth(),
today.getDate(),
entry.hour,
30
);
return [date, entry.pred];
});
- entity: sensor.daily_energy_pv_pool
name: Ertrag
yaxis_id: accuracy_axis
color: orange
float_precision: 1
unit: " kWh"
show:
legend_value: true
in_header: true
in_chart: false
data_generator: |
return [[new Date(), parseFloat(entity.state)]];
- entity: sensor.sfml_stats_pv_pool
name: Prognose heute
yaxis_id: accuracy_axis
color: grey
float_precision: 1
unit: " kWh"
show:
legend_value: true
in_header: true
in_chart: false
data_generator: |
return [[new Date(), entity.attributes.prediction_total]];
- entity: sensor.sfml_stats_pv_pool
name: Genauigkeit
yaxis_id: accuracy_axis
color: green
float_precision: 0
unit: " %"
show:
legend_value: true
in_header: true
in_chart: false
data_generator: |
return [[new Date(), entity.attributes.accuracy]];
- entity: sensor.sun_solar_elevation
name: Sonnenhöhe
type: line
color: gold
stroke_width: 2
yaxis_id: sun
extend_to: false
show:
legend_value: false
in_header: false
in_legend: true
group_by:
func: avg
duration: 10m
- entity: sensor.sun_solar_elevation
name: Sonnenpunkt
type: line
yaxis_id: sun
extend_to: false
color: gold
stroke_width: 0
show:
legend_value: false
in_header: false
in_legend: false
data_generator: |
return [[Date.now(), Number(entity.state)]];
card_mod:
style: |
ha-card {
background: transparent !important;
box-shadow: none !important;
border: none !important;
padding: 1px;
font-size: 11px;
border-radius: 12px;
margin-top: -10px;
}
grid_options:
columns: 16
rows: auto
- type: entities
entities:
- entity: sensor.none_produktionszeit_heute
- entity: sensor.solar_forecast_ml_ml_metrics
- entity: sensor.solar_forecast_ml_physics_samples
- entity: sensor.solar_forecast_ml_active_prediction_model
- entity: sensor.solar_forecast_ml_ki_drift_status
- entity: sensor.solar_forecast_ml_o_genauigkeit_30_tage
- entity: sensor.solar_forecast_ml_ai_rmse
grid_options:
columns: 10
rows: auto
card_mod:
style: |
ha-card {
background: transparent;
border: none;
padding: 1px;
font-size: 11px; /* Basisgröße */
}
- type: markdown
content: >-
| Stunde | Verlust | Ursache |
| :--- | ---: | :--- |
{% set icons = {
'🌙 Nacht': '🌙',
'❄️ Schnee': '❄️',
'❄️ Frost': '❄️',
'☁️ Wolken': '☁️',
'🏠 Verschattung': '🏠',
'🌅 Tiefer Sonnenstand': '🌅',
'☀️ Besser als Prognose': '☀️'
} -%}
{%- for item in state_attr('sensor.solar_forecast_ml_schatten_heute',
'hourly_breakdown') %}
{%- set cause =
'🌙 Nacht' if item.root_cause == 'Nacht' else
'❄️ Schnee' if item.root_cause == 'Schnee' or item.snow_covered else
'❄️ Frost' if item.root_cause == 'Frost' else
'☁️ Wolken' if item.root_cause == 'Wolken' else
'🏠 Verschattung' if item.root_cause == 'Mögliche Verschattung' else
'🌅 Tiefer Sonnenstand' if item.root_cause == 'Tiefer Sonnenstand' else
'🔝 Besser als Prognose' if item.root_cause == 'Klarer als Prognose' else
'🆗 Normale Schwankung' if item.root_cause == 'Normale Schwankung' else
'🔎 ' ~ (item.root_cause | replace('_',' '))
-%}
{%- set icon = icons.get(cause, '') -%}
| {{ '%02d' | format(item.hour) }}:00 | {{ item.shadow_percent }}% |
{{ icon }} {{ cause | replace(icon ~ ' ', '') }} |
{% endfor %}
grid_options:
columns: 6
rows: 6
text_only: true
card_mod:
style: |
ha-card {
background: transparent;
border: none;
padding: 1px;
margin-left: 10px;
font-size: 11px; /* Basisgröße */
}
column_span: 4
- type: grid
cards:
- type: custom:apexcharts-card
graph_span: 70d
span:
end: day
header:
show: true
title: PV Produktion vs. Prognose + Abweichung
show_states: true
colorize_states: true
apex_config:
chart:
height: 350
toolbar:
show: true
tools:
download: false
selection: true
zoom: true
zoomin: true
zoomout: true
pan: true
reset: true
zoom:
enabled: true
type: x
autoScaleYaxis: true
timezone: Europe/Vienna
xaxis:
type: datetime
labels:
datetimeUTC: false
legend:
show: false
grid:
borderColor: rgba(150,150,150,0.15)
strokeDashArray: 3
plotOptions:
bar:
borderRadius: 5
columnWidth: 60%
fill:
type: gradient
gradient:
shade: light
type: vertical
shadeIntensity: 0.5
opacityFrom: 1
opacityTo: 0.7
stops:
- 0
- 100
stroke:
curve: smooth
annotations:
yaxis:
- "y": 26
yAxisIndex: 1
borderColor: "#000000"
strokeDashArray: 4
strokeWidth: 2
series:
- entity: sensor.pv_ertrag_pro_tag_insgesamt
name: PV Ertrag
type: column
color: "#FFA500"
stroke_width: 0
yaxis_id: energy
group_by:
duration: 1d
func: max
- entity: sensor.none_prognose_heute
name: Prognose
type: column
color: black
stroke_width: 0
yaxis_id: energy
group_by:
duration: 1d
func: last
- entity: sensor.pv_forecast_deviation_percent_solar_forecast_ml
name: Abweichung
type: line
color: "#2e7d32"
stroke_width: 3
extend_to: false
yaxis_id: abweichung
group_by:
duration: 1d
func: last
yaxis:
- id: energy
decimals: 0
apex_config:
title:
text: Energieertrag (kWh)
- id: abweichung
opposite: true
decimals: 0
min: -50
max: 50
apex_config:
title:
text: Abweichung (%) zur Prognose
card_mod:
style: |
ha-card {
background: transparent !important;
box-shadow: none !important;
margin-top: -1px;
font-size: 11px;
}
grid_options:
columns: 48
rows: 7
column_span: 4
background:
opacity: 80
alignment: center
size: cover
repeat: repeat
attachment: fixed
image:
media_content_id: media-source://image_upload/1f945a4a5ec908dbd37d742ccacf09a8
media_content_type: image/png
metadata:
title: ChatGPT Image 18. Feb. 2026, 20_23_45.png
thumbnail: /api/image/serve/1f945a4a5ec908dbd37d742ccacf09a8/256x256
media_class: image
navigateIds:
- {}
- media_content_type: app
media_content_id: media-source://image_upload
cards: []
Das ist der Code des gesamten Dashboards. Sorry fürs Offtopic hier @Tom-HA .
2 „Gefällt mir“
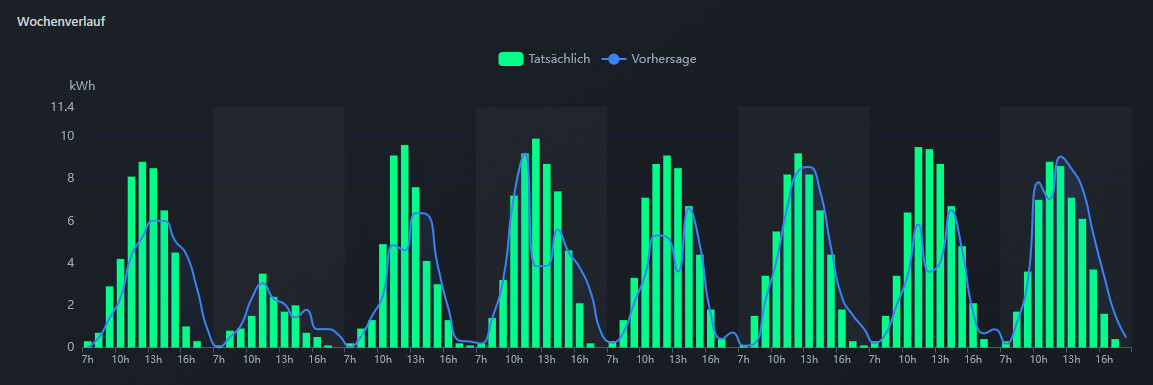
Den Hügel hatte ich heute auch. Merkwürdigerweise auch genau um 17 Uhr 
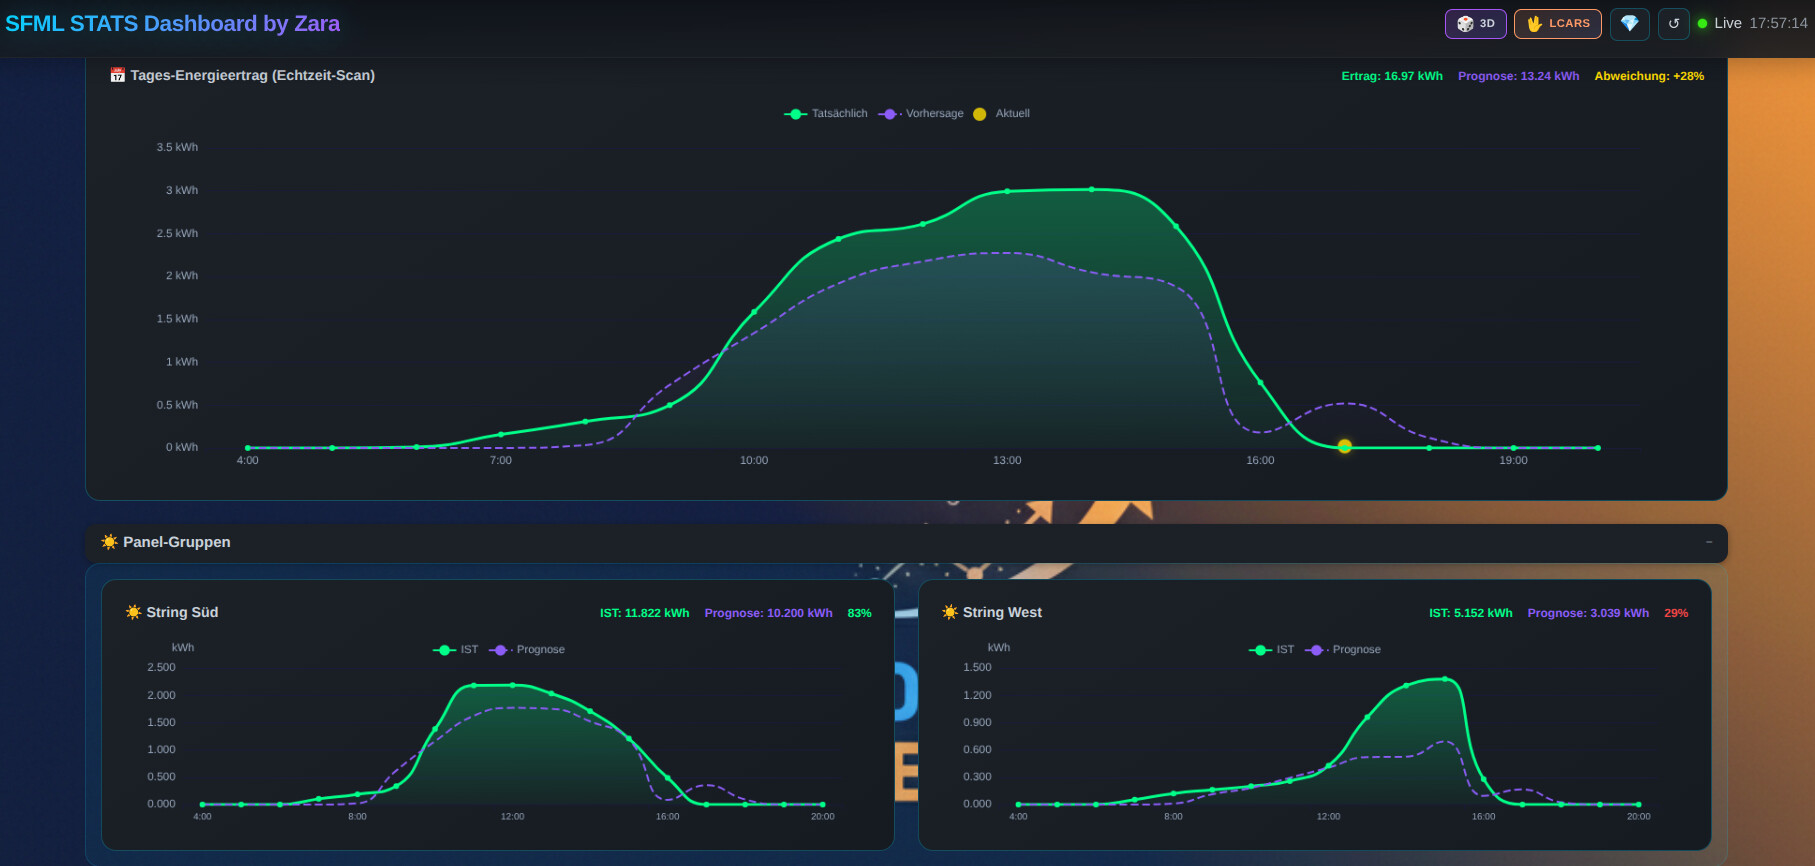
Bei dem Buckel muss die KI noch lernen, auch wenn da Vorhersage steht, hat das mit der eigentlichen Vorhersage nichts zu tuen. Die Grafik ist in der Developerversion vohanden, damit Tom hier ablesen kann wo die KI noch lernen muß. Die eigentliche Vorhersage wird kurz vor Sonnenaufgang einmalig erstellt und besteht nur aus einem einzigen Wert!
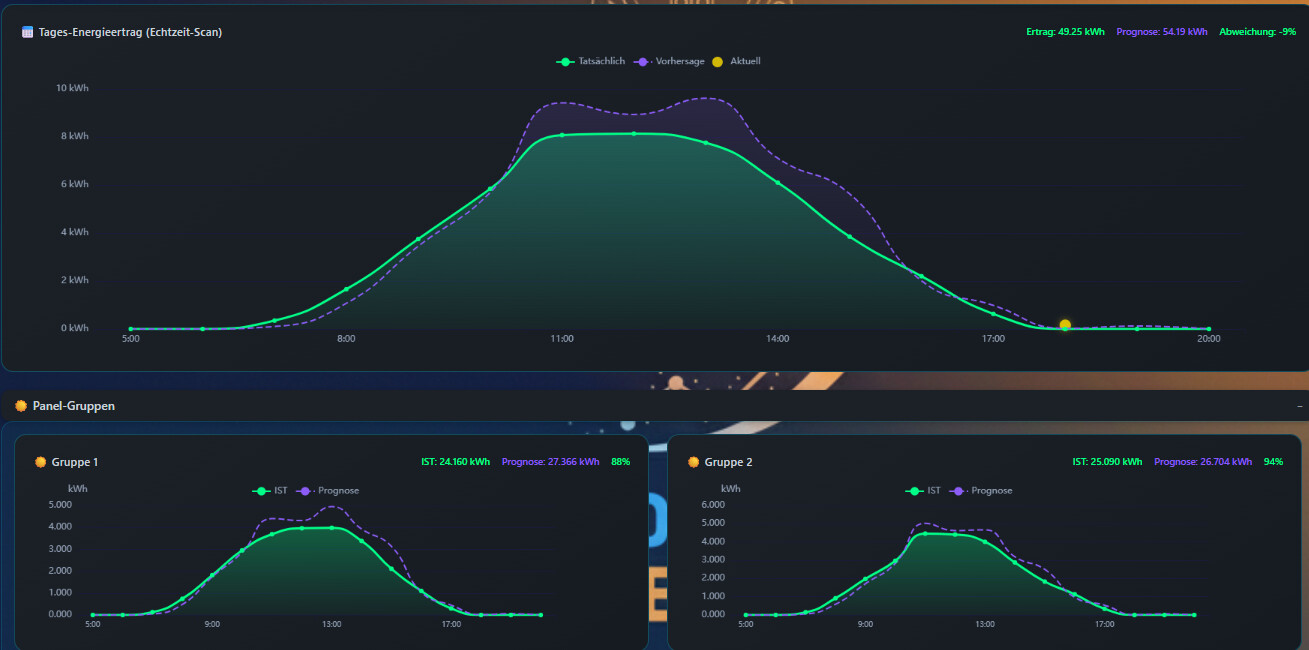
Auch hier gilt, die Sonne ist abends viel länger am Himmel, das muß die KI auch erst einmal lernen. Mein Buckel ist nur sehr gering ausgeprägt.
Gruß Ralf
2 „Gefällt mir“