Hallo,
ich möchte in einer Zeile vorne die Bedeutung dahinter die Temperatur und dann den Ventilstand anzeigen.
Z.B.
Wohnzimmer 21,3°C 15%
Das habe ich.
Nun möchte ich die Zahlen mit Einheiten in verschiedenen Farben (Ampel) darstellen.
Ich habe nichts gefunden wie ich das hin bekomme, ich kann nur die ganze Zeile einfärben.
Kann mir jemand helfen?
Gruß
Wilhelm
Ich hatte so eine frühere Karte noch auf meiner Spielwiese. Müßte mich nochmal reinarbeiten.
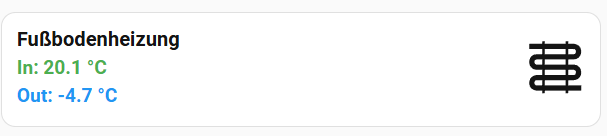
Aber vielleicht reicht es Dir als Orientierung
type: custom:button-card
name: Fußbodenheizung
icon: mdi:heating-coil
show_name: true
show_icon: true
show_state: false
custom_fields:
  t_in: |
    [[[
      return `In: ${states['sensor.om_temperatur_bad_durchschnitt'].state} °C`;
    ]]]
  t_out: |
    [[[
      return `Out: ${states['sensor.om_temperatur_draussen_unten_durchschnitt'].state} °C`;
    ]]]
styles:
  grid:
    - grid-template-areas: |
        "n i"
        "t_in i"
        "t_out i"
    - grid-template-columns: 1fr auto
    - row-gap: 4px
  card:
    - padding: 12px
  name:
    - grid-area: "n"
    - justify-self: start
    - align-self: center
    - font-weight: 600
  icon:
    - grid-area: i
    - justify-self: end
    - align-self: center
    - width: 52px
    - height: 52px
  custom_fields:
    t_in:
      - grid-area: t_in
      - justify-self: start
      - font-size: 16px
      - font-weight: 700
      - color: |
          [[[
            const t = parseFloat(states['sensor.om_temperatur_bad_durchschnitt'].state);
            if (isNaN(t)) return 'var(--primary-text-color)';
            return t < 18 ? 'var(--blue-color)' :
                   t < 22 ? 'var(--green-color)' :
                            'var(--red-color)';
          ]]]
    t_out:
      - grid-area: t_out
      - justify-self: start
      - font-size: 16px
      - font-weight: 700
      - color: |
          [[[
            const t = parseFloat(states['sensor.om_temperatur_draussen_unten_durchschnitt'].state);
            if (isNaN(t)) return 'var(--primary-text-color)';
            return t < 10 ? 'var(--blue-color)' :
                   t < 20 ? 'var(--orange-color)' :
                            'var(--red-color)';
          ]]]
Die lösung in verschiedenen Zeilen hatte ich auch. Ich wollte es aber in einer Zeile. Vieleicht muss ich umdenken.
Danke für den Tipp.

Der Code ist zu 90 % ChatGPT generiert, Rest habe ich angepaßt ohne mich in die Custom-button-card wieder einzuarbeiten. Wenn Du KI funktionieren Code gibst, sind sie besser.
type: custom:button-card
name: Fußbodenheizung
icon: mdi:heating-coil

show_name: true
show_icon: true
show_state: false

custom_fields:
  temps: >
    [[[
      const tin = parseFloat(states['sensor.om_temperatur_bad_durchschnitt'].state);
      const tout = parseFloat(states['sensor.om_temperatur_draussen_unten_durchschnitt'].state);

      const cin  = 'var(--green-color)';
      const cout = 'var(--blue-color)';

      return `
        <div style="display:flex; gap:14px;">
          <span style="color:${cin}; font-weight:600;">In: ${tin} °C</span>
          <span style="color:${cout}; font-weight:600;">Out: ${tout} °C</span>
        </div>
      `;
    ]]]

styles:
  grid:
    - grid-template-areas: |
        "n i"
        "temps i"
    - grid-template-columns: 1fr auto

  card:
    - padding: 8px 14px

  name:
    - grid-area: n
    - justify-self: start
    - align-self: end
    - margin-bottom: 10px
    - font-size: 16px
    - font-weight: 600

  custom_fields:
    temps:
      - grid-area: temps
      - justify-self: start
      - align-self: start
      - margin-top: -6px
      - font-size: 14.5px
      - line-height: 1.5

  icon:
    - grid-area: i
    - justify-self: end
    - align-self: center
    - margin-top: 6px
    - width: 44px
    - height: 44px
Die KI hat bei mir versagt. Nach dem Xten Versuch habe ich es aufgegeben.
Ich werde die Lösung nehmen und anpassen.
 by HarryP: Zusammenführung Doppelpost (bei Änderungen oder hinzufügen von Inhalten bitte die „Bearbeitungsfunktion“ anstatt „Antworten“ zu nutzen)
Den Ansatz von dir fand ich richtig gut, habe die Optik für mich angepasst und wollte sie euch nit vorenthalten.

type: custom:button-card
name: Bastelzimmer
icon: mdi:radiator
show_name: true
show_icon: true
show_state: false
custom_fields:
  temps: |
    [[[
      const tin = parseFloat(states['sensor.temperatur_spitzboden_temperature'].state);
      const tout = parseFloat(states['number.trv_giebel_spitzboden_valve_opening_degree'].state);

      const cin  = 'var(--red-color)';
      const cout = 'var(--blue-color)';

      return `
        <div style="display:flex; gap:14px;">
          <span style="color:${cin}; font-weight:bold;">🌡 ${tin} °C</span>
          <span style="color:${cout}; font-weight:bold;">⋈ ${tout} %</span>
        </div>
      `;
    ]]]
styles:
  grid:
    - grid-template-areas: |
        "n i"
        "temps i"
  card:
    - padding: 5px 14px
    - margin-top: "-2px"
    - margin-bottom: "-2px"
  name:
    - grid-area: "n"
    - justify-self: start
    - align-self: end
    - margin-bottom: 5px
    - font-size: 0.9em
    - font-weight: lightbold
  custom_fields:
    temps:
      - grid-area: temps
      - justify-self: start
      - align-self: start
      - margin-top: "-6px"
      - font-size: 0.7em
      - line-height: 1.5
  icon:
    - grid-area: i
    - justify-self: end
    - align-self: center
    - width: 35px
    - height: 35px
Nachtrag: Wenn man jetzt noch die jeweiligen Werte für die Statistik anklicken könnte, wäre das für mich perfekt. Hat jemand eine Idee, wie man das mit einbaut?
Ich dachte, wir reden hier von der BUTTON Karte - das muß doch machbar sein.
Bei allem andauernden Ärger mit KI, ist es dann auch wieder erstaunlich wie man mit einem Scriptgrundverständnis die sich ständig verrennende KI wieder zurück auf Spur bringt. Ich habe die Doku immer noch nicht erneut gelesen aber mehrfach KI gesagt, lies die Doku https://github.com/custom-cards/button-card und dann kam ein Codevorschlag wo ich nur noch margin etc anpassen mußte: Zeitdauer 30 min
Der Trick, Einbindung einer horizontal-stack in der dann nochmal die Button Karte eingebunden wird.

type: custom:button-card
name: Fußbodenheizung
icon: mdi:heating-coil
show_name: true
show_icon: true
show_state: false
styles:
  grid:
    - grid-template-areas: |
        "n i"
        "temps temps"
    - grid-template-columns: 1fr auto
  card:
    - padding: 5px 14px
  name:
    - grid-area: "n"
    - justify-self: start
    - align-self: start
    - font-size: 16px
    - font-weight: 600
  icon:
    - grid-area: i
    - justify-self: end
    - align-self: right
    - width: 44px
    - height: 44px
  custom_fields:
    temps:
      - grid-area: temps
      - justify-self: start
      - margin-top: "-20px"
custom_fields:
  temps:
    card:
      type: horizontal-stack
      cards:
        - type: custom:button-card
          entity: sensor.om_temperatur_bad_durchschnitt
          show_icon: false
          show_name: false
          show_state: true
          state_display: |
            [[[
              const s = states['sensor.om_temperatur_bad_durchschnitt'];
              if (!s || s.state === 'unknown') return 'In: -- °C';
              return `In: ${s.state} °C`;
            ]]]
          tap_action:
            action: more-info
          styles:
            card:
              - background: none
              - box-shadow: none
              - border: none
              - padding: 0
              - margin: 0
            state:
              - white-space: nowrap
              - font-weight: 600
              - color: |
                  [[[
                    const s = states['sensor.om_temperatur_bad_durchschnitt'];
                    if (!s) return 'var(--disabled-text-color)';
                    const t = parseFloat(s.state);
                    if (isNaN(t)) return 'var(--disabled-text-color)';
                    if (t < 18) return 'var(--blue-color)';
                    if (t < 22) return 'var(--green-color)';
                    return 'var(--orange-color)';
                  ]]]
        - type: custom:button-card
          entity: sensor.om_temperatur_draussen_unten_durchschnitt
          show_icon: false
          show_name: false
          show_state: true
          state_display: |
            [[[
              const s = states['sensor.om_temperatur_draussen_unten_durchschnitt'];
              if (!s || s.state === 'unknown') return 'Out: -- °C';
              return `Out: ${s.state} °C`;
            ]]]
          tap_action:
            action: more-info
          styles:
            card:
              - background: none
              - box-shadow: none
              - border: none
              - padding: 0
              - margin-left: 12px
            state:
              - white-space: nowrap
              - font-weight: 600
              - color: |
                  [[[
                    const s = states['sensor.om_temperatur_draussen_unten_durchschnitt'];
                    if (!s) return 'var(--disabled-text-color)';
                    const t = parseFloat(s.state);
                    if (isNaN(t)) return 'var(--disabled-text-color)';
                    if (t < 0) return 'var(--blue-color)';
                    if (t < 10) return 'var(--cyan-color)';
                    return 'var(--green-color)';
                  ]]]
Viel Spaß