Danke fürs teilen. Hat funktioniert. nicht 100% elegant aber es sieht soweit gut aus 
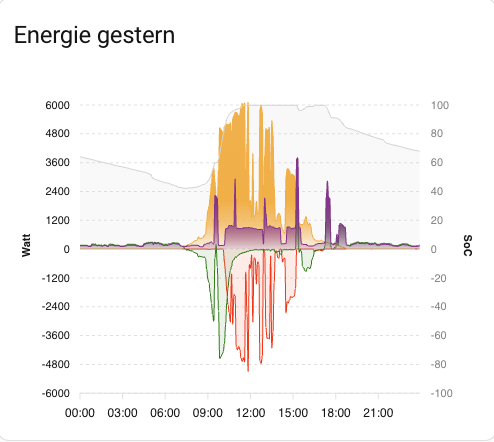
Habe mir dies für den gestringen Tag gebaut das ich sehe wie es gestern war.
type: custom:apexcharts-card
experimental:
  color_threshold: true
  brush: false
  disable_config_validation: true
update_interval: 1min
grid_options:
  columns: full
header:
  show: false
  title: Energie gestern
  show_states: true
  colorize_states: true
  standard_format: true
  floating: false
graph_span: 24h
yaxis:
  - id: watt
    decimals: 0
    min: -6000
    max: 6000
    title:
      text: Watt
    apex_config:
      tickAmount: 10
      forceNiceScale: true
  - id: prozent
    show: true
    decimals: 0
    opposite: true
    min: -100
    max: 100
    unit_of_measurement: "%"
    title:
      text: SoC
    labels:
      style:
        colors: gray
    apex_config:
      tickAmount: 10
      forceNiceScale: true
      foreColor: blue
span:
  start: day
apex_config:
  chart:
    height: 350
    zoom:
      type: x
      enabled: true
    toolbar:
      show: false
    xaxis.type: datetime
  legend:
    show: false
  stroke:
    width: 1
    curve: smooth
all_series_config:
  type: area
  curve: smooth
  stroke_width: 1.2
  float_precision: 0
  show:
    in_header: raw
    legend_value: false
  opacity: 0.2
  color_threshold:
    - value: 0
      opacity: 0.1
    - value: 1000
      opacity: 0.7
    - value: 2000
      opacity: 1
  group_by:
    func: median
    duration: 5minute
  extend_to: now
series:
  - entity: sensor.rct_power_storage_grid_power
    name: Netz
    color: red
    yaxis_id: watt
    offset: "-1d"
  - entity: sensor.rct_power_storage_generator_a_power
    name: Solar
    color: orange
    yaxis_id: watt
    offset: "-1d"
  - entity: sensor.rct_power_storage_battery_power
    name: Batterie
    color: green
    yaxis_id: watt
    offset: "-1d"
  - entity: sensor.rct_power_storage_consumer_power
    name: Haushalt
    color: purple
    yaxis_id: watt
    offset: "-1d"
  - entity: sensor.rct_power_storage_battery_state_of_charge
    name: SoC
    color: lightgray
    opacity: null
    yaxis_id: prozent
    offset: "-1d"
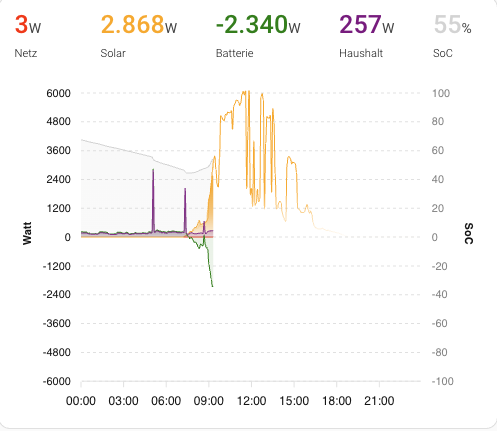
heutige tag:
type: custom:apexcharts-card
experimental:
  color_threshold: true
  brush: false
  disable_config_validation: true
update_interval: 1min
grid_options:
  columns: full
header:
  show: true
  title: ""
  show_states: true
  colorize_states: true
  standard_format: true
  floating: false
graph_span: 24h
yaxis:
  - id: watt
    decimals: 0
    min: -6000
    max: 6000
    title:
      text: Watt
    apex_config:
      tickAmount: 10
      forceNiceScale: true
  - id: prozent
    show: true
    decimals: 0
    opposite: true
    min: -100
    max: 100
    unit_of_measurement: "%"
    title:
      text: SoC
    labels:
      style:
        colors: gray
    apex_config:
      tickAmount: 10
      forceNiceScale: true
      foreColor: blue
span:
  start: day
apex_config:
  chart:
    height: 350
    zoom:
      type: x
      enabled: true
    toolbar:
      show: false
    xaxis.type: datetime
  legend:
    show: false
  stroke:
    width: 1
    curve: smooth
all_series_config:
  type: area
  curve: smooth
  stroke_width: 1.2
  float_precision: 0
  show:
    in_header: raw
    legend_value: false
  opacity: 0.2
  color_threshold:
    - value: 0
      opacity: 0.1
    - value: 1000
      opacity: 0.7
    - value: 2000
      opacity: 1
  group_by:
    func: median
    duration: 5minute
  extend_to: now
series:
  - entity: sensor.rct_power_storage_grid_power
    name: Netz
    color: red
    yaxis_id: watt
  - entity: sensor.rct_power_storage_generator_a_power
    name: Solar
    color: orange
    yaxis_id: watt
  - entity: sensor.rct_power_storage_battery_power
    name: Batterie
    color: green
    yaxis_id: watt
  - entity: sensor.rct_power_storage_consumer_power
    name: Haushalt
    color: purple
    yaxis_id: watt
  - entity: sensor.rct_power_storage_battery_state_of_charge
    name: SoC
    color: lightgray
    opacity: null
    yaxis_id: prozent
  - entity: sensor.rct_power_storage_generator_a_power
    name: Solar gestern
    type: line
    color: orange
    offset: "-1d"
    show:
      in_header: false
    yaxis_id: watt
wie baue ich jetzt einen wert ein welcher in KWh ist also ein PV forcast (Forecast.Solar)?