Hallo zusammen,
ich habe mir folgendes Chart erstellt um die monatliche Solarproduktion anzuzeigen.
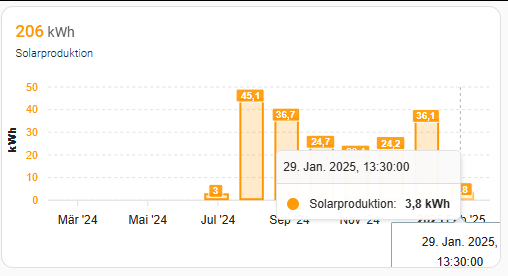
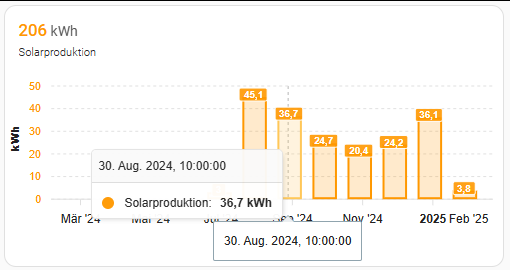
Leider wird jedoch die Summe des Monats nicht bis zum letzten Monatstag 24Uhr berechnet, sondern immer einen Tag früher (siehe Screenshots).
Somit beginnt der Folgemonat auch früher und die Berechnung ist um ca. 1,5 Tage “verschoben”…
Hat da eventuell jemand eine Idee wie man das lösen kann?
type: custom:apexcharts-card
stacked: true
card_mod:
  style: |
    #state__value > #state {
      font-size: 1.2em !important;
    }
    .apexcharts-tooltip-series-group {
      padding-top: 0px !important;
      padding-bottom: 0px !important;
      margin-top: 0px !important;
      margin-bottom: 0px !important;
      display: none;
      text-align: left;
      justify-content: left;
      align-items: center;
    }
    #header {
        padding: 1rem !important;
    }
yaxis:
  - id: kwh
    decimals: 0
    min: 0
    max: 50
    apex_config:
      tickAmount: 5
      forceNiceScale: true
      title:
        text: " kWh"
        rotate: -90
      labels:
        style:
          colors: var(--energy-solar-color)
apex_config:
  chart:
    height: 175px
    offsetX: 0
    offsetY: -20
  legend:
    show: false
  dataLabels:
    style:
      fontSize: 0.7rem
    rotate: 90
span:
  end: month
graph_span: 1y
update_interval: 1h
header:
  show: true
  show_states: true
  colorize_states: true
  standard_format: false
all_series_config:
  type: column
  float_precision: 1
  statistics:
    type: sum
    period: day
  group_by:
    func: diff
    start_with_last: false
    duration: 1month
  show:
    in_header: false
    datalabels: true
  opacity: 0.2
  stroke_width: 2
  unit: " kWh"
series:
  - entity: sensor.solarproduktion_gesamt
    yaxis_id: kwh
    name: Solarproduktion
    color: var(--energy-solar-color)
  - entity: sensor.solarproduktion_gesamt
    yaxis_id: kwh
    name: Solarproduktion
    color: var(--energy-solar-color)
    show:
      in_header: raw
      in_chart: false