Hallihallo,
ich habe Tankerkoenig im Einsatz, um mir aktuelle Preise der Tankstellen in meiner Umgebung anzuzeigen. Dazu habe ich mir eine (aus meiner Sicht) übersichtliche Button-card gebastelt, die mir die Min- und Max-Werte der letzten 7 Tage, Adresse, die aktuellen E10 und Dieselpreise anzeigt und ob die Tankstelle geöffnet hat. Die Min- Max-Preise dienen zur Orientierung, ob der aktuelle Preis günstig ist.
So sieht die Custom Button Card auf dem Dashboard aus:
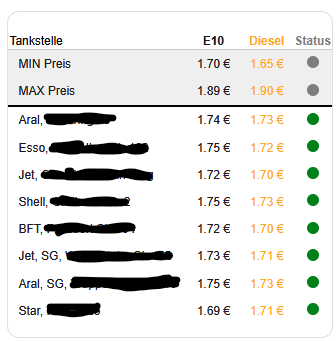
Im Code kann man eine beliebige Anzahl von Tankstellen angeben. Die Button Card wird automatisch angepasst.
Ist mein erster Entwurf und es geht bestimmt noch schöner ;-), aber vielleicht passt es ja für euch.
Gruß Tom
Falls es jemand nachbauen möchte hier der Code der Button Card:
type: custom:button-card
icon: mdi:gas-station-in-use
show_state: false
show_label: false
layout: vertical
styles:
  card:
    - border-radius: 12px
    - padding: 6px
    - font-family: Arial
    - text-align: center
  name:
    - font-size: 18px
    - font-weight: bold
    - color: "#1799b2"
    - justify-self: center
  icon:
    - width: 40px
    - height: 40px
    - color: "#1799b2"
    - justify-self: center
custom_fields:
  table:
    card:
      type: custom:button-card
      show_state: false
      show_label: false
      name: |
        [[[
          const stations = [
            { name: "MIN Preis", e10_sensor: 'sensor.e10preis_min', diesel_sensor: 'sensor.dieselpreis_min', status_sensor: 'binary_sensor.muster' },
            { name: "MAX Preis", e10_sensor: 'sensor.e10preis_max', diesel_sensor: 'sensor.dieselpreis_max', status_sensor: 'binary_sensor.muster' },

##########################################
### Diesen Absatz für jede Tankstelle anpassen und wiederholen
##########################################
            { name: "Aral, xxxx", e10_sensor: 'sensor.aral_xxx_super_e10', diesel_sensor: 'sensor.aral_xxxx_diesel', status_sensor: 'binary_sensor.aral_xxxx_status' },
##########################################

          const fuelStations = stations.slice(2);
          let minE10 = Math.min(...fuelStations.map(s => parseFloat(states[s.e10_sensor]?.state) || Infinity));
          let minDiesel = Math.min(...fuelStations.map(s => parseFloat(states[s.diesel_sensor]?.state) || Infinity));

          let rows = stations.map((s, index) => {
            const e10 = states[s.e10_sensor] ? parseFloat(states[s.e10_sensor].state).toFixed(2) : "-";
            const diesel = states[s.diesel_sensor] ? parseFloat(states[s.diesel_sensor].state).toFixed(2) : "-";
            const statusRaw = states[s.status_sensor] ? states[s.status_sensor].state : "-";
            const statusText = statusRaw === "on" ? "Offen" : (statusRaw === "off" ? "Geschlossen" : "unbekannt");
            const statusColor = statusRaw === "on" ? "green" : (statusRaw === "off" ? "red" : "gray");

            const e10Color = (parseFloat(e10) === minE10) ? "green" : "var(--button-text-color)";
            const dieselColor = (parseFloat(diesel) === minDiesel) ? "green" : "orange";

            const borderBottom = index === 1 ? "border-bottom:2px solid #000;" : "";
            const bgColor = (index === 0 || index === 1) ? "background-color:#f0f0f0;" : "";

            // Status als farbiger Kreis mit Tooltip
            const statusCircle = `<span title="${statusText}" style="display:inline-block; width:12px; height:12px; border-radius:50%; background-color:${statusColor};"></span>`;

            return `<tr style="${borderBottom} ${bgColor}">
                      <td style="padding:6px 10px; text-align:left; font-weight:normal;">${s.name}</td>
                      <td style="padding:6px 10px; text-align:center; color:${e10Color};">${e10} €</td>
                      <td style="padding:6px 10px; text-align:center; color:${dieselColor};">${diesel} €</td>
                      <td style="padding:6px 10px; text-align:center;">${statusCircle}</td>
                    </tr>`;
          }).join("");

          return `<table style="width:100%; border-collapse:collapse; margin-top:8px;">
                    <tr style="border-bottom:1px solid #ccc;">
                      <th align="left" style="text-align:left; font-weight:normal; color:black;">Tankstelle</th>
                      <th style="color:var(--button-text-color);">E10</th>
                      <th style="color:orange;">Diesel</th>
                      <th style="color:gray;">Status</th>
                    </tr>
                    ${rows}
                  </table>`;
        ]]]
      styles:
        name:
          - white-space: normal
          - font-family: Arial
          - font-size: 12px
          - font-weight: normal
          - color: var(--button-text-color)
          - line-height: 1.2
Dazu habe ich in der configuration.yml folgende Variablen definiert:
#Benzinpreise Min/Max Sensors
- platform: statistics
  name: "Dieselpreis-max"
  entity_id: sensor.aral_xxx_diesel
  unique_id: "Dieselpreis-max"
  state_characteristic: value_max
  sampling_size: 10000
  max_age:
    days: 7

- platform: statistics
  name: "Dieselpreis-min"
  entity_id: sensor.aral_xxxx_diesel
  unique_id: "Dieselpreis-min"
  state_characteristic: value_min
  sampling_size: 10000
  max_age:
    days: 7
- platform: statistics
  name: "E10preis-max"
  entity_id: sensor.aral_xxxxx_super_e10
  unique_id: "E10preis-max"
  state_characteristic: value_max
  sampling_size: 10000
  max_age:
    days: 7

- platform: statistics
  name: "E10preis-min"
  entity_id: sensor.aral_xxxx_super_e10
  unique_id: "E10preis-min"
  state_characteristic: value_min
  sampling_size: 10000
  max_age:
    days: 7