Ares
1. Dezember 2024 um 14:53
1
Hallo zusammen,
type: custom:plotly-graph
title: TEST
hours_to_show: 24
entities:
  - entity: input_boolean.hlpbinauf
    name: VENTIL
    line:
      width: 1
    fill: tonexty
    fillcolor: rgba(226,245,39,.2)
    showlegend: false
layout:
  paper_bgcolor: transparent
  plot_bgcolor: transparent
  height: 250
config:
  displayModeBar: false
view_layout:
  position: main
LvS21
1. Dezember 2024 um 15:06
2
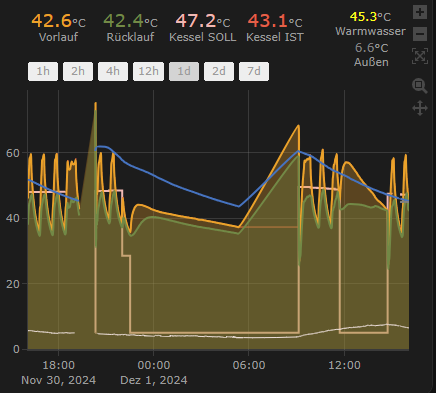
Ich selber nutze die Plotly-Card zur visualisierung unsere Heizungsparameter:
type: custom:plotly-graph
entities:
  - entity: sensor.wolf_tob_0x3_210072_kesselsolltemperatur
    line:
      color: rgb(255, 180, 180)
      width: 2
  - entity: sensor.wolf_tob_0x3_210003_kesseltemperatur
    line:
      color: rgb(255, 80, 80)
      width: 1
  - entity: sensor.wolf_dhk_bm2_0x30_340011_vorlauftemperatur
    name: Vorlauf
    line:
      color: rgb(255, 155, 48)
      width: 2
      shape: spline
    fill: tozeroy
    fillcolor: rgba(255, 155, 48, 0.3)
    show_value: false
    showlegend: false
  - entity: sensor.wolf_tob_0x3_210004_ruecklauftemperatur
    name: Rücklauf
    line:
      color: rgb(108, 138, 68)
      width: 2
      shape: spline
    fill: tozeroy
    fillcolor: rgba(108, 138, 68, 0.3)
    show_value: false
    showlegend: false
  - entity: sensor.wolf_tob_0x3_210016_warmwassertemperatur
    line:
      color: rgb(26, 118, 192)
      width: 2
      shape: spline
  - entity: sensor.wolf_tob_0x3_210015_aussentemperatur
    line:
      color: rgb(243, 223, 220)
      width: 1
      shape: spline
  - entity: sensor.wolf_warmwassermintemperatur
    line:
      color: grey
      width: 2
hours_to_show: 1d
refresh_interval: 10
layout:
  yaxis:
    title: °C
  height: 400
  margin:
    r: 25
    t: 90
  annotations:
    - text: |-
        $fn ({hass}) =>
          "<span style='font-size: 18px;'><span style='color: rgb(255, 155, 48)'>"
          + Number(hass.states['sensor.wolf_dhk_bm2_0x30_340011_vorlauftemperatur'].state).toFixed(1) + "</span></span>°C<br>"
          +  "</span><span style=''>Vorlauf</span><br>"
      xref: x domain
      yref: y domain
      xanchor: center
      yanchor: center
      x: 0.08
      "y": 1.32
      showarrow: false
    - text: |-
        $fn ({hass}) =>
          "<span style='font-size: 18px;'><span style='color: rgb(108, 138, 68)'>"
          + Number(hass.states['sensor.wolf_tob_0x3_210004_ruecklauftemperatur'].state).toFixed(1) + "</span></span>°C<br>"
          +  "</span><span style=''>Rücklauf</span><br>"
      xref: x domain
      yref: y domain
      xanchor: center
      yanchor: center
      x: 0.27
      "y": 1.32
      showarrow: false
    - text: |-
        $fn ({hass}) =>
          "<span style='font-size: 18px;'><span style='color: rgb(255, 180, 180)'>"
          + Number(hass.states['sensor.wolf_tob_0x3_210072_kesselsolltemperatur'].state).toFixed(1) + "</span></span>°C<br>"
          +  "</span><span style=''>Kessel SOLL</span><br>"
      xref: x domain
      yref: y domain
      xanchor: center
      yanchor: center
      x: 0.46
      "y": 1.32
      showarrow: false
    - text: |-
        $fn ({hass}) =>
          "<span style='font-size: 18px;'><span style='color: rgb(255, 80, 80)'>"
          + Number(hass.states['sensor.wolf_tob_0x3_210003_kesseltemperatur'].state).toFixed(1) + "</span></span>°C<br>"
          +  "</span><span style=''>Kessel IST</span><br>"
      xref: x domain
      yref: y domain
      xanchor: center
      yanchor: center
      x: 0.65
      "y": 1.32
      showarrow: false
    - text: |-
        $fn ({hass}) =>
          "<span style='font-size: 12px;'><span style='color: gray'>"
          + Number(hass.states['sensor.wolf_bm2_0x30_220103_aussentemperatur'].state).toFixed(1) + "</span></span>°C<br>"
          +  "</span><span style=''>Außen</span><br>"
      xref: x domain
      yref: y domain
      xanchor: center
      yanchor: center
      x: 0.9
      "y": 1.2
      showarrow: false
    - text: |-
        $fn ({hass}) =>
          "<span style='font-size: 12px;'><span style='color: yellow'>"
          + Number(hass.states['sensor.wolf_tob_0x3_210016_warmwassertemperatur'].state).toFixed(1) + "</span></span>°C<br>"
          +  "</span><span style=''>Warmwasser</span><br>"
      xref: x domain
      yref: y domain
      xanchor: center
      yanchor: center
      x: 0.9
      "y": 1.32
      showarrow: false
  showlegend: false
  xaxis:
    rangeselector:
      "y": 1.034
      buttons:
        - count: 1
          step: hour
        - count: 2
          step: hour
        - count: 4
          step: hour
        - count: 12
          step: hour
        - count: 1
          step: day
        - count: 2
          step: day
        - count: 7
          step: day
Mir ist nicht klar, welche Art der Anzeige du erreichen möchtest. Beschreibe doch mal etwas genau.
Ares
1. Dezember 2024 um 19:19
3
Danke für die prompte Reaktion. Also, ich habe mir gedacht, so wie Du es für Vorlauf, Rücklauf usw. gemacht hast, oben die beiden Werte: “Dauer: xx.xx Std” und “Anzahl: xx”, wobei:
Dauer: Summe der Zeitspannen, wo der Helper auf “off” stand
Anzahl: Anzahl der Statuswechsel von “on” auf “off”
für die Betrachtungszeitspanne. Ginge denn so was?
LvS21
2. Dezember 2024 um 07:27
4
Ich habe etwas gegooelt und die history_stats von HA entdeckt.
Hier als Beispiel mal für einen Smart Switch meiner Installation.
- platform: history_stats
  name: licht_bad_eltern_l1 Einschaltzeit
  entity_id: light.licht_bad_eltern_l1
  state: 'on'
  type: time
  start: '{{ now().replace(hour=0, minute=0, second=0) }}'
  end: '{{ now() }}'

- platform: history_stats
  name: licht_bad_eltern_l1 Einschaltanzahl
  entity_id: light.licht_bad_eltern_l1
  state: 'on'
  type: count
  start: '{{ now().replace(hour=0, minute=0, second=0) }}'
  end: '{{ now() }}'
Dieser Sensor zählt, wie oft bzw. wie lange die Lampe seit Mitternacht eingeschaltet wurde. Damit solltest du deine Wünsche realisieren könne.
Diese Video könnte dir auch noch helfen.
1 „Gefällt mir“
Ares
2. Dezember 2024 um 18:58
6
Besten Dank!
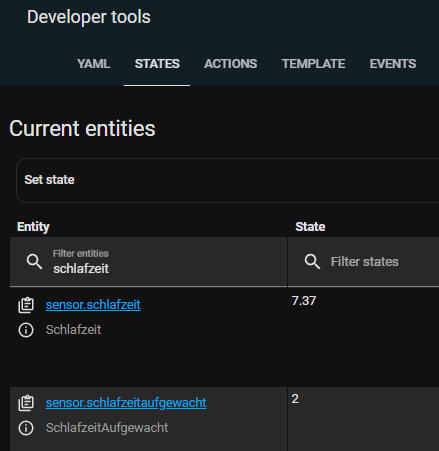
Das sieht mal gut aus. Ich kann berechnen, wie lange ich die letzten 24 Std geschlafen und wieviel mal aufgewacht habe.
- platform: history_stats
  name: Schlafzeit
  entity_id: input_boolean.hlpbinauf
  state: 'off'
  type: time
  start: "{{ now() - timedelta(hours=24) }}"
  end: '{{ now() }}'

- platform: history_stats
  name: SchlafzeitAufgewachtRoh
  entity_id: input_boolean.hlpbinauf
  state: 'off'
  type: count
  start: "{{ now() - timedelta(hours=24) }}"
  end: '{{ now() }}'
LvS21
2. Dezember 2024 um 19:41
7
So AdHoc würde ich dies über einen Template Helfer lösen.
Ares
2. Dezember 2024 um 22:00
8