Hi,
mein NUC läuft Permanent auf ca.8% CPU Auslastungen und nicht unter 41% CPU Temperatur. Ist das bei euch ebenfalls so?
Grds. macht das Ding kaum etwas daher kann ich die Auslastung nicht nachvollziehen. Die Temperatur scheint auch ziemlich hoch zu sein oder ist das so ok?
1 „Gefällt mir“
Bei meinem NUC i5 5250 habe ich folgende Werte.
Alles auf HAOS.

Es gibt unter Linux den Befehlt top. Das könntest du mal über cli versuchen. Ich weiß aber nicht ob das in HA auch funktioniert. 8% dauerhaft, ach ohne Last, finde ich etwas zu hoch. Obwohl 8% nicht viel sind.
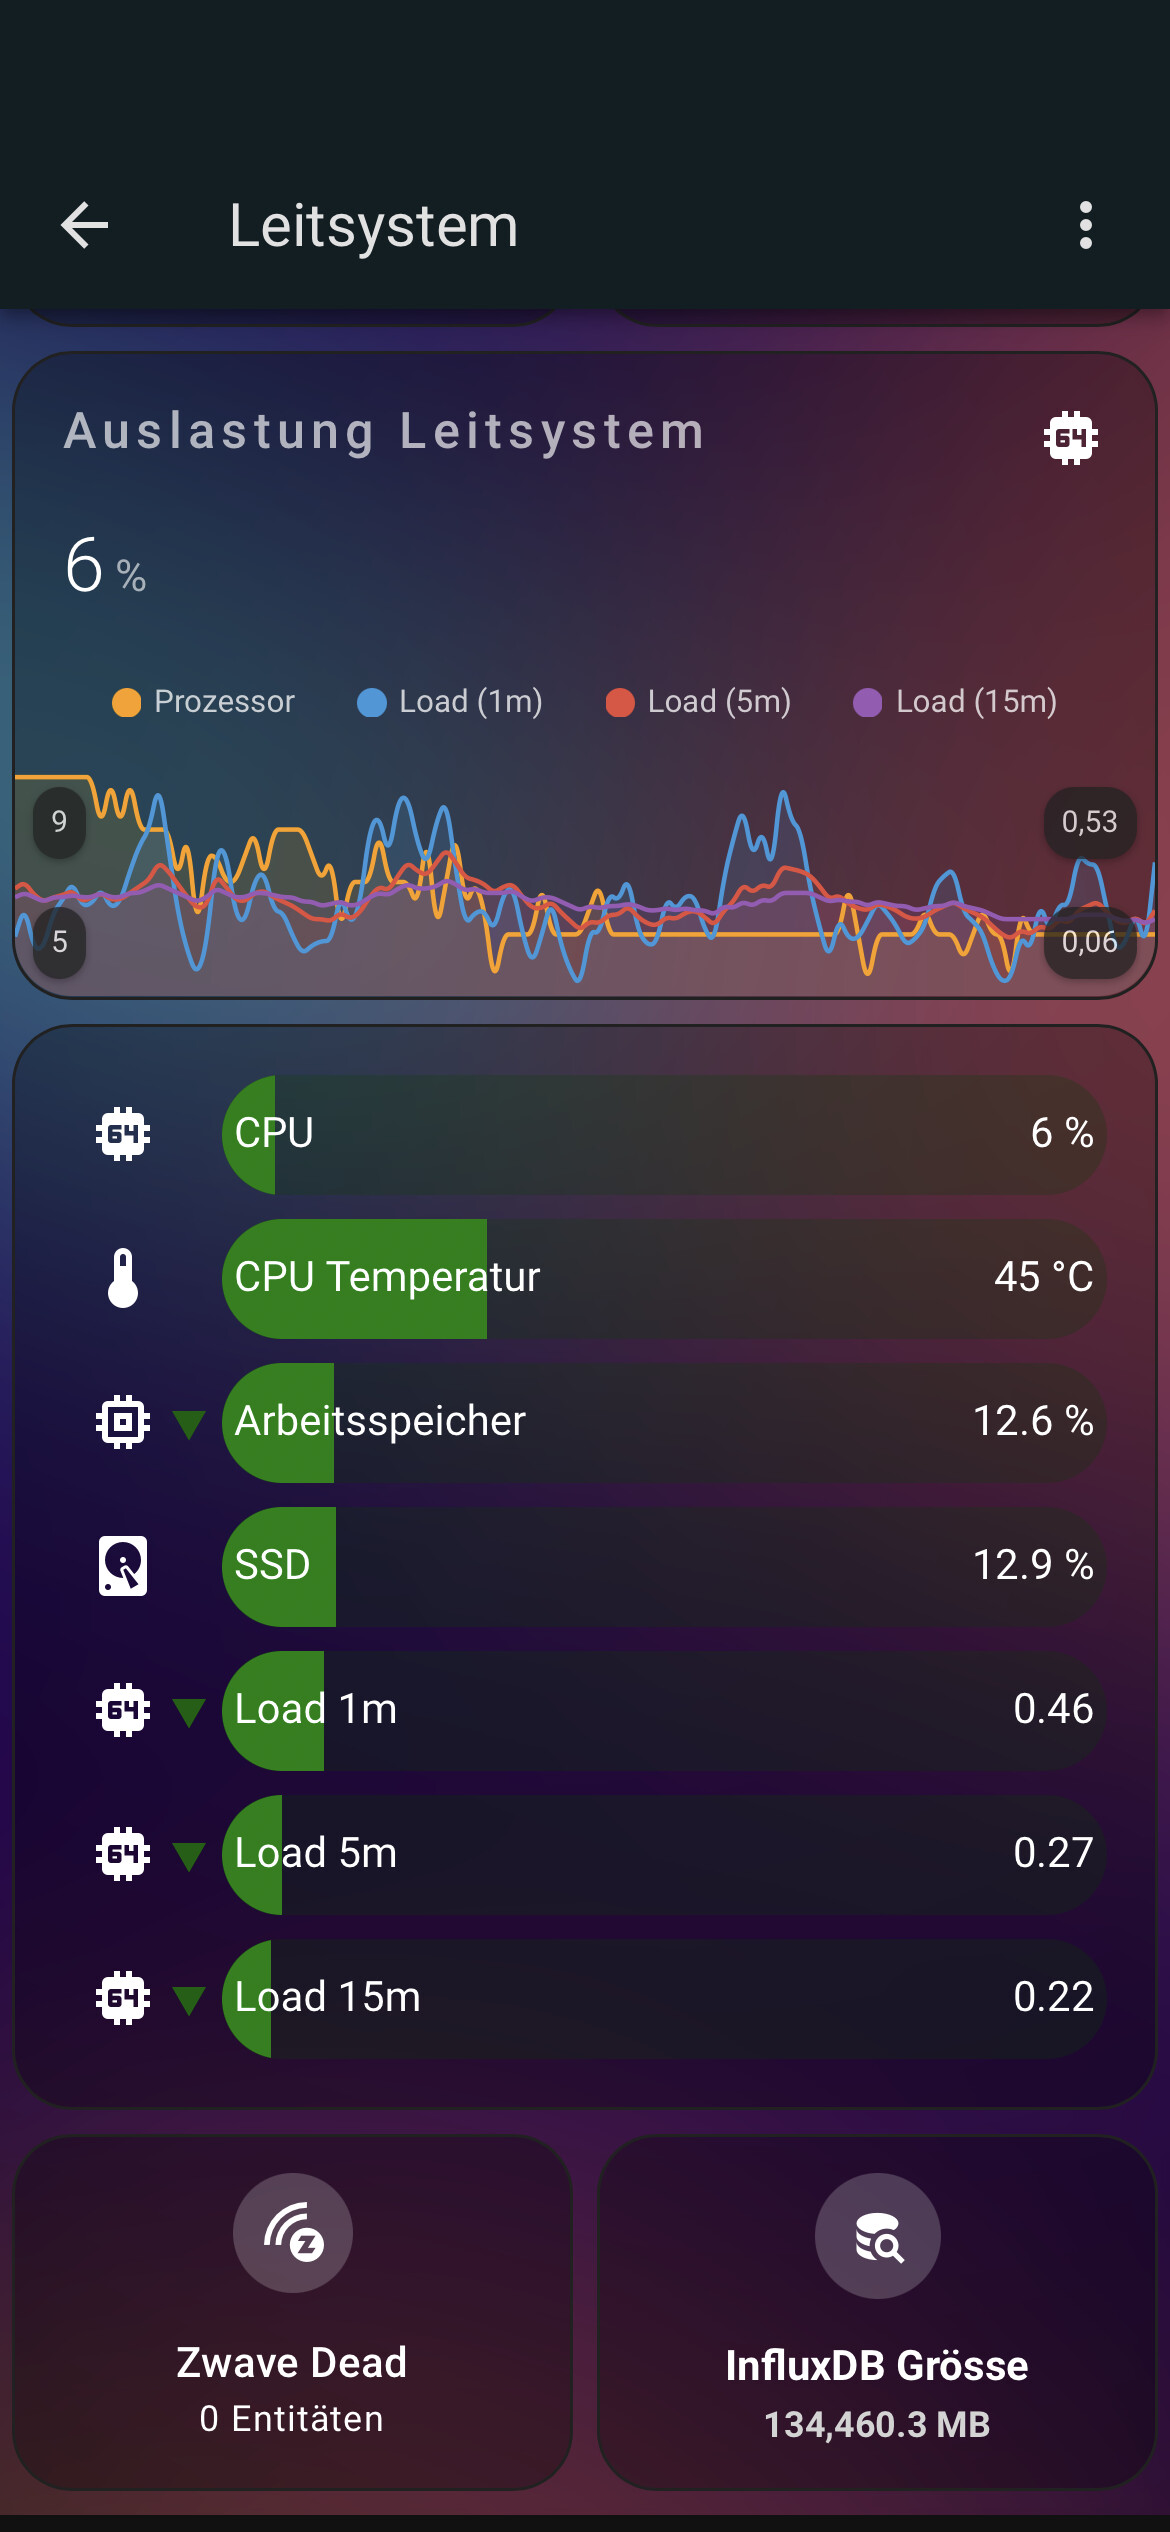
Kommt darauf an, was du alles am Laufen hast. Meine Nuc läuft so zwischen 6 und 8% und ist so 45C warm. Solange dieser dauerhaft nicht über 60C liegt, ist alles im grünen Bereich.
2 „Gefällt mir“
ich hab den Teufel gefunden ![]() Es ist bei mir das Frigate Addon. Sobald ich es abschalte habe ich nur noch 2%. Naja leider brauche ich Frigate aber die CPU Temperatur bleibt weiterhin bei 40% obwohl die Rechenleistung sinkt…
Es ist bei mir das Frigate Addon. Sobald ich es abschalte habe ich nur noch 2%. Naja leider brauche ich Frigate aber die CPU Temperatur bleibt weiterhin bei 40% obwohl die Rechenleistung sinkt…
1 „Gefällt mir“
@guezli Das sieht cool aus.
Wie hast du das so hinbekommen.
Würdest du mir/uns den Code zeigen?
Danke
Helmut
Klar. Hier ist der Graph
type: custom:mini-graph-card
entities:
  - entity: sensor.processor_use
    name: Prozessor
    show_state: false
  - entity: sensor.load_1m
    y_axis: secondary
    show_state: false
  - entity: sensor.load_5m
    y_axis: secondary
    show_state: false
  - entity: sensor.load_15m
    y_axis: secondary
    show_state: false
name: Auslastung Leitsystem
hours_to_show: 1
aggregate_func: avg
points_per_hour: 120
update_interval: 10
line_width: 2
fill: fade
cache: true
animate: true
hour24: true
font_size: 75
group_by: interval
tap_action:
  action: navigate
  navigation_path: /lovelace/nuc
show:
  labels: true
  labels_secondary: true
und hier ist die Barcard:
type: custom:bar-card
entities:
  - entity: sensor.processor_use
    name: CPU
    max: '100'
    min: '0'
    severity:
      - color: green
        from: 0
        to: 65
      - color: Orange
        from: 66
        to: 80
      - color: red
        from: 81
        to: 100
    decimal: '0'
  - entity: sensor.cpu_temperatur
    name: CPU Temperatur
    decimal: '0'
    max: '80'
    severity:
      - color: green
        from: 0
        to: 55
      - color: orange
        from: 56
        to: 75
      - color: red
        from: 75
        to: 100
    min: '30'
  - entity: sensor.memory_use_percent
    name: Arbeitsspeicher
    decimal: '1'
    max: '100'
    min: '0'
    severity:
      - color: green
        from: 0
        to: 65
      - color: orange
        from: 66
        to: 80
      - color: red
        from: 81
        to: 100
  - entity: sensor.disk_use_percent
    name: SSD
    decimal: '1'
    max: '100'
    min: '0'
    severity:
      - color: green
        from: 0
        to: 65
      - color: orange
        from: 66
        to: 80
      - color: red
        from: 81
        to: 100
  - entity: sensor.load_1m
    max: '4'
    min: '0'
    severity:
      - color: green
        from: 0
        to: 1
      - color: orange
        from: 1.01
        to: 3
      - color: red
        from: 3.01
        to: 4
    name: Load 1m
    decimal: '2'
  - entity: sensor.load_5m
    max: '4'
    min: '0'
    severity:
      - color: green
        from: 0
        to: 1
      - color: orange
        from: 1.01
        to: 3
      - color: red
        from: 3.01
        to: 4
    name: Load 5m
    decimal: '2'
  - entity: sensor.load_15m
    max: '4'
    min: '0'
    severity:
      - color: green
        from: 0
        to: 1
      - color: orange
        from: 1.01
        to: 3
      - color: red
        from: 3.01
        to: 4
    name: Load 15m
    decimal: '2'
columns: '1'
3 „Gefällt mir“
Danke
Die sensoren hast du vom Systemmonitor?
LG
Helmut
Ja. Ausser die Temperatur, diese musste ich via Comandline auslesen.
Das ist meine Möhle seit Oktober 2020…:
https://www.mydealz.de/deals/hp-prodesk-400-g5-mini-pc-i5-8gb-ram-256gb-ssd-1674124#comments
Allerdings mit 32GB Speicher und noch einer 1TB SSD.
Läuft seitdem 24/7 mit Proxmox und darunter ein Dutzend VMs und Container inkl. HA.
CPU/Cores bei durchschnittlich 15-20% Auslastung nie unter 68°C. Das sind doch völlig normale Temperaturen und absolut im grünen Bereich.
Unter einer Windows VM läuft auch noch BlueIris, eine Video Survillance SW mit 2 IP-Kameras. Die verbraucht am meisten CPU-Resourcen und puscht Alles im Dauerbetrieb über die 10%-Hürde.
Hallo @guezli
Ich habe ein kleines Problem. Vielleicht kannst du mir ja weiterhelfen?
Ich habe eine eigene sensor.yaml Darin ist jetzt dazugekommen die systemmonitor.yaml
- platform: systemmonitor
  resources:
    - type: disk_use_percent
      arg: /config
    - type: disk_use
    - type: disk_free
    - type: memory_use_percent
    - type: memory_use
    - type: memory_free
    - type: swap_use_percent
    - type: swap_use
    - type: swap_free
    - type: load_1m
    - type: load_5m
    - type: load_15m
    - type: network_in
      arg: eth0
    - type: network_out
      arg: eth0
    - type: throughput_network_in
      arg: eth0
    - type: throughput_network_out
      arg: eth0
    - type: packets_in
      arg: eth0
    - type: packets_out
      arg: eth0
    - type: ipv4_address
      arg: eth0
    - type: ipv6_address
      arg: eth0
    - type: processor_use
    - type: processor_temperature
    - type: last_boot
Nur wird mir die disk_use_percent nicht angezeigt?

Die CPU Temp hab ich noch nicht angelegt?
Hast du vielleicht eine Idee
Wünsche Dir einen guten Rutsch
LG
Helmut
Ich habe im NUC sensor.processor_temperature als Entität
type: entities
entities:
  - entity: sensor.processor_temperature
  - entity: sensor.processor_use
  - entity: sensor.disk_use_percent_config
  - entity: sensor.local_ip
  - entity: sensor.load_1m
  - entity: sensor.load_5m
  - entity: sensor.load_15m
  - entity: sensor.last_boot
title: Intel NUC
Ich musste die CPU Temperatur via Commandline auslesen. Hier wird beschrieben wie das geht.
Warum die Disk Use Procent nicht geht, weiss ich auch nicht. Eventuell kann dir jemand anderes weiterhelfen. Du könntest diese auch berechnen (Belegter Speicher / Disk Grösse), wenn es nicht klappt und du aber die notwendigen Sensoren hast.
1 „Gefällt mir“
Hallo und Prosit 2024
also disk_use_percent habe ich hinbekommen.
Da war das “arg: /config” zuviel. Ohne dem funktioniert es.
Nur das mit der command_line bekomme ich nicht hin.
Hab jetzt auch noch das probiert und eine unique_id vergeben:
Im der configuration.yaml habe ich folgendes eingetragen:
# Example configuration.yaml entry
command_line:
  - sensor:
      name: CPU Temperature
      unique_id: "cpu_temperatur"
      command: "cat /sys/class/thermal/thermal_zone1/temp"
      # If errors occur, make sure configuration file is encoded as UTF-8
      unit_of_measurement: "°C"
      value_template: "{{ value | multiply(0.001) | round(1) }}"
Wobei bei thermal_zone habe ich 0 und 1 probiert?
Die Bar-Card sieht so aus:
type: custom:bar-card
entities:
  - entity: sensor.processor_use
    name: CPU
    max: '100'
    min: '0'
    severity:
      - color: green
        from: 0
        to: 65
      - color: Orange
        from: 66
        to: 80
      - color: red
        from: 81
        to: 100
    decimal: '0'
  - entity: cpu_temperatur
    name: CPU Temperature
    decimal: '0'
    max: '80'
    severity:
      - color: green
        from: 0
        to: 55
      - color: orange
        from: 56
        to: 75
      - color: red
        from: 75
        to: 100
    min: '30'
  - entity: sensor.memory_use_percent
    name: Arbeitsspeicher
    decimal: '1'
    max: '100'
    min: '0'
    severity:
      - color: green
        from: 0
        to: 65
      - color: orange
        from: 66
        to: 80
      - color: red
        from: 81
        to: 100
  - entity: sensor.disk_use_percent
    name: SSD
    decimal: '1'
    max: '100'
    min: '0'
    severity:
      - color: green
        from: 0
        to: 65
      - color: orange
        from: 66
        to: 80
      - color: red
        from: 81
        to: 100
  - entity: sensor.load_1m
    max: '4'
    min: '0'
    severity:
      - color: green
        from: 0
        to: 1
      - color: orange
        from: 1.01
        to: 3
      - color: red
        from: 3.01
        to: 4
    name: Load 1m
    decimal: '2'
  - entity: sensor.load_5m
    max: '4'
    min: '0'
    severity:
      - color: green
        from: 0
        to: 1
      - color: orange
        from: 1.01
        to: 3
      - color: red
        from: 3.01
        to: 4
    name: Load 5m
    decimal: '2'
  - entity: sensor.load_15m
    max: '4'
    min: '0'
    severity:
      - color: green
        from: 0
        to: 1
      - color: orange
        from: 1.01
        to: 3
      - color: red
        from: 3.01
        to: 4
    name: Load 15m
    decimal: '2'
columns: '1'
Wer kann mir da bitte noch weiter helfen.
Herzlichen Dank
Helmut
So alles erledigt:
So funktioniert es: Hier configuration.yaml
command_line:
  - sensor:
      name: CPU Temperature
      unique_id: "cpu_temperatur"
      command: "cat /sys/class/thermal/thermal_zone1/temp"
      # If errors occur, make sure configuration file is encoded as UTF-8
      unit_of_measurement: "°C"
      value_template: "{{ value | multiply(0.001) | round(1) }}"
Hier die systemmonitor.yaml
- platform: systemmonitor
  resources:
    - type: disk_use_percent
    - type: disk_use
    - type: disk_free
    - type: memory_use_percent
    - type: memory_use
    - type: memory_free
    - type: swap_use_percent
    - type: swap_use
    - type: swap_free
    - type: load_1m
    - type: load_5m
    - type: load_15m
    - type: network_in
      arg: eth0
    - type: network_out
      arg: eth0
    - type: throughput_network_in
      arg: eth0
    - type: throughput_network_out
      arg: eth0
    - type: packets_in
      arg: eth0
    - type: packets_out
      arg: eth0
    - type: ipv4_address
      arg: eth0
    - type: ipv6_address
      arg: eth0
    - type: processor_use
    - type: processor_temperature
    - type: last_boot


@guezli
Was mich noch wundert, ist aber nur die Optik, bei dir sind die Ecken abgerundet?
Obwohl ich deinen gepusteten Code gestohlen habe?
Gruß
Helmut
Ist das eine Bubble Card ??
Nein eine Custom.bar-Card
Ich nutze das Kibibit-Theme. Die rundet die Balken ab.![]()
Das Theme findest du auf Hacs.
2 „Gefällt mir“
@guezli
finde das Kibibit-Theme leider nicht in HACS . Hab ich vielleicht Tomaten auf den Augen ?
Gruß und danke
Füge es einfach als Benutzerdefiniertes Repository zu: GitHub - Kibibit/hass-kibibit-theme: A milky glass theme for Home Assistant
Konntest du das installieren?
